> For the complete documentation index, see [llms.txt](https://academy.carto.com/llms.txt). Markdown versions of documentation pages are available by appending `.md` to page URLs; this page is available as [Markdown](https://academy.carto.com/working-with-geospatial-data/geospatial-data-the-basics/types-of-location-data.md).
# Types of location data
The two primary spatial data types are raster and vector - but what’s the difference?
## Raster data
Raster data is represented as a grid of cells or pixels, with each cell containing a value or attribute. It has a grid-based structure and represents continuous values such as elevation, temperature, or satellite imagery.
### Common raster file types
Common file types for raster data include:
* **GeoTIFF:** a popular raster file format with embedded georeferencing.
* **JPEG, PNG & BMP:** ubiquitous image files which can be georeferenced with a World or TAB file. PNG supports lossless compression and transparency, making it particularly useful for spatial visualization.
* **ASCII:** stores gridded data in ASCII text format. Each cell value is represented as a text string in a structured grid format, making it easy to read and manipulate.
You may also encounter: ERDAS, NetCDF, HDF, ENVI, xyz.
***
## Vector data
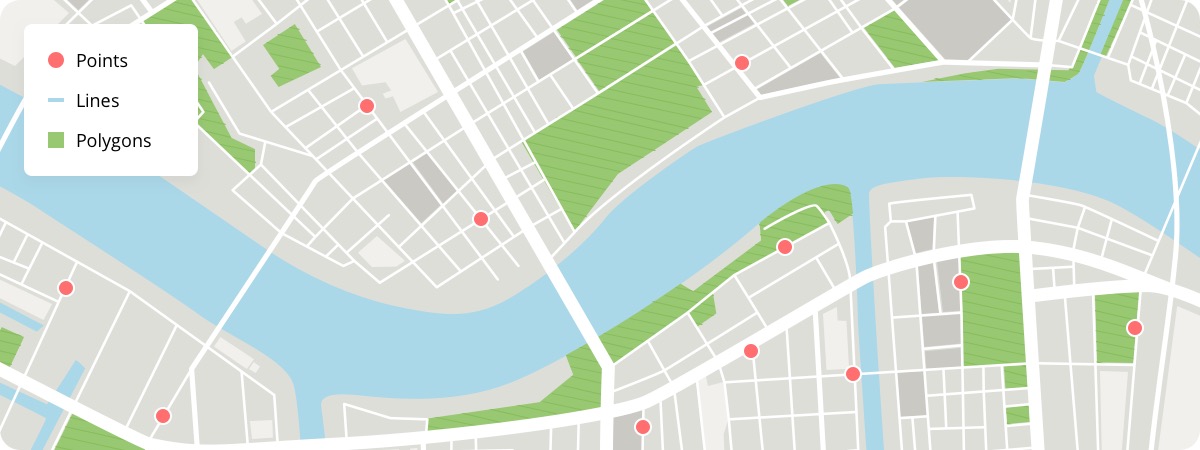
Vector data represents geographic features as discrete points, lines, and polygons.It has a geometry-based structure in which each element in vector data represents a discrete geographic object, such as roads, buildings, or administrative boundaries. Vector data is scalable without loss of quality and can be easily modified or updated.
Vector data is useful for spatial analysis operations such as overlaying, buffering, and network analysis, facilitating advanced geospatial studies. Vector data formats are also well-suited for data editing, updates, and maintenance, making them ideal for workflows that require frequent changes.
### Common vector file types
#### Shapefiles
Shapefiles are a format developed by ESRI. They have been widely adopted across the spatial industry, but their drawbacks see them losing popularity. These drawbacks include:
1. **Shareability:** They consist of multiple files (.shp, .shx, .dbf, etc.) that comprise one shapefile, which can make them tricky for non-experts to share and use.
2. **Limited Attribute Capacity:** Shapefiles are limited to a maximum of 255 attributes.
3. **Lack of Native Support for Unicode Characters:** This can cause issues when working with datasets that contain non-Latin characters or multilingual attributes.
4. **Lack of Topology Information:** Shapefiles do not inherently support topological relationships, such as adjacency, connectivity, or overlap between features.
5. **No Native Support for Time Dimension:** No native time field type.
6. **Lack of Direct Data Compression:** Shapefiles do not provide built-in compression options, which can result in larger file sizes.
Limited File Size Limitations: Shapefile size is limited to 2 GB.
#### Other vector file types
1. **GeoJSON (Geographic JavaScript Object Notation):** GeoJSON is an open standard file format based on JSON (JavaScript Object Notation). It allows for the storage and exchange of geographic data in a human-readable and machine-parseable format.
2. **KML/KMZ (Keyhole Markup Language):** KML is an XML-based file format used for representing geographic data and annotations. It was originally developed for Google Earth but has since become widely supported by various GIS software. KMZ is a compressed version of KML, bundling multiple files together.
3. **GPKG (Geopackage):** GPKG is an open standard vector file format developed by the Open Geospatial Consortium (OGC). It is a SQLite database that can store multiple layers of vector data along with their attributes, styling, and metadata. GPKG is designed to be platform-independent and self-contained.
4. **FGDB (File Geodatabase):** FGDB is a proprietary vector file format developed by Esri as part of the Esri Geodatabase system.
5. **GML (Geography Markup Language):** GML is an XML-based file format developed by the [OGC](https://www.ogc.org/).
***
## Everything in-between
There is a small area in between raster and vector data types, with Spatial Indexes being one of the most ubiquitous data types here.
**Spatial Indexes** are global grids - in that sense, they are a lot like raster data. However, they render a lot like vector data; each "cell" in the grid is an individual feature which can be interrogated. They can be used for both vector-based analysis (like running intersections and spatial joins) and raster-based analysis (like slope or hotspot analysis).
But where they really excel is in their size, and subsequent processing and analysis speeds. Spatial Indexes are "geolocated" through a reference string, not a long geometry description (like vector data). This makes them small, and quick. So many organizations are now taking advantage of Spatial Indexes to enable highly performant analysis of truly big spatial data. Find out more about these in the ebook[ Spatial Indexes 101.](https://go.carto.com/report-spatial-indexes-101)
{% content-ref url="/pages/NbCyXX2Mu8yrVpzNa5M5" %}
[Introduction to Spatial Indexes](/working-with-geospatial-data/introduction-to-spatial-indexes.md)
{% endcontent-ref %}
---
# Agent Instructions
This documentation is published with GitBook. GitBook is the documentation platform designed so that both humans and AI agents can read, navigate, and reason over technical content effectively. Learn more at gitbook.com.
## Querying This Documentation
If you need additional information that is not directly available in this page, you can query the documentation dynamically by asking a question.
Perform an HTTP GET request on the current page URL with the `ask` query parameter, and the optional `goal` query parameter:
```
GET https://academy.carto.com/working-with-geospatial-data/geospatial-data-the-basics/types-of-location-data.md?ask=&goal=
```
`ask` is the immediate question: it should be specific, self-contained, and written in natural language.
`goal` is optional and describes the broader end goal you are ultimately trying to accomplish on behalf of the user. GitBook uses it to tailor the answer towards what is most useful for that goal.
The response will contain a direct answer to the question and relevant excerpts and sources from the documentation.
Use this mechanism when the answer is not explicitly present in the current page, you need clarification or additional context, or you want to retrieve related documentation sections.