Data enrichment using the Data Observatory

In this guide you will learn how to perform data enrichment using Data Observatory data and the Analytics Toolbox. You can also access and run this guide using this Google Colab notebook.
Prefer a low-code approach? Check out our Workflows templates for Data Enrichment.
1. Create a connection with BigQuery in the CARTO Workspace
Sign into your CARTO Workspace. If you still don’t have an account, you can sign-up here for a 14-day trial.
Navigate to the Connections section.
Create a new connection with BigQuery. You may choose the Service Account (SA) or the “Sign in with Google” options depending on where you are planning to run your queries:
If you are going to use the BigQuery console, please use the “Sign in with Google” option.
If you are going to use a BigQuery client instead (a Python notebook for instance), please use the SA option and make sure you use that same SA to authenticate in the client.
For more details, please refer to the documentation.
2. Subscribe to the Data Observatory datasets
Navigate to the Data Observatory section of the CARTO Workspace.
Using the Spatial Data Catalog, subscribe to the following datasets, both available for free. You can find these datasets by using the search bar or the filter column on the left of the screen:
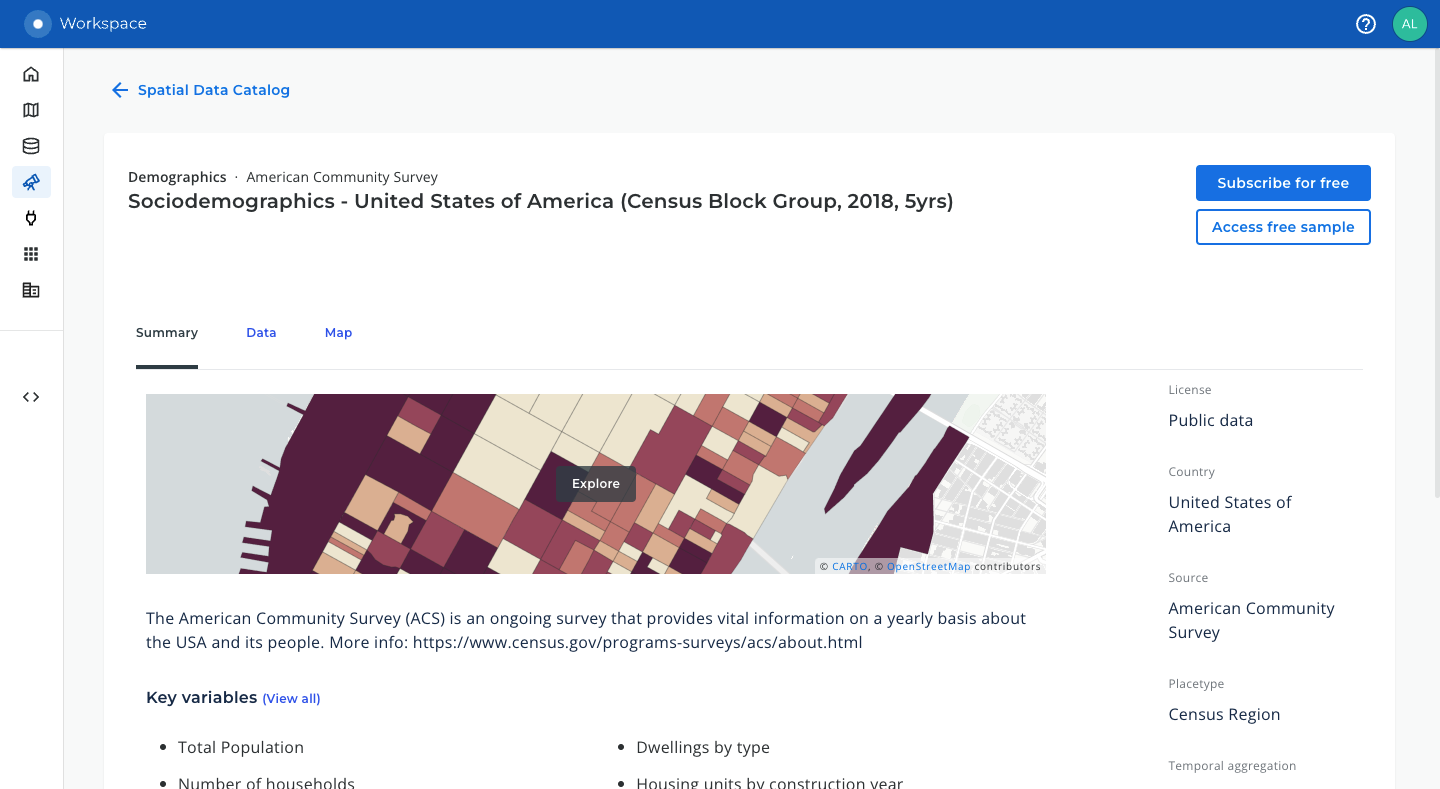
Sociodemographics - United States of America (Census Block Group, 2018, 5yrs) from American Community Survey.*
*Please note that this data was retired from the in June 2025. You can find similar data products from providers like the ACS by searching for publicly-available demographics data in the Data Observatory.
Nodes - United States of America (Latitude/Longitude) from OpenStreetMap.

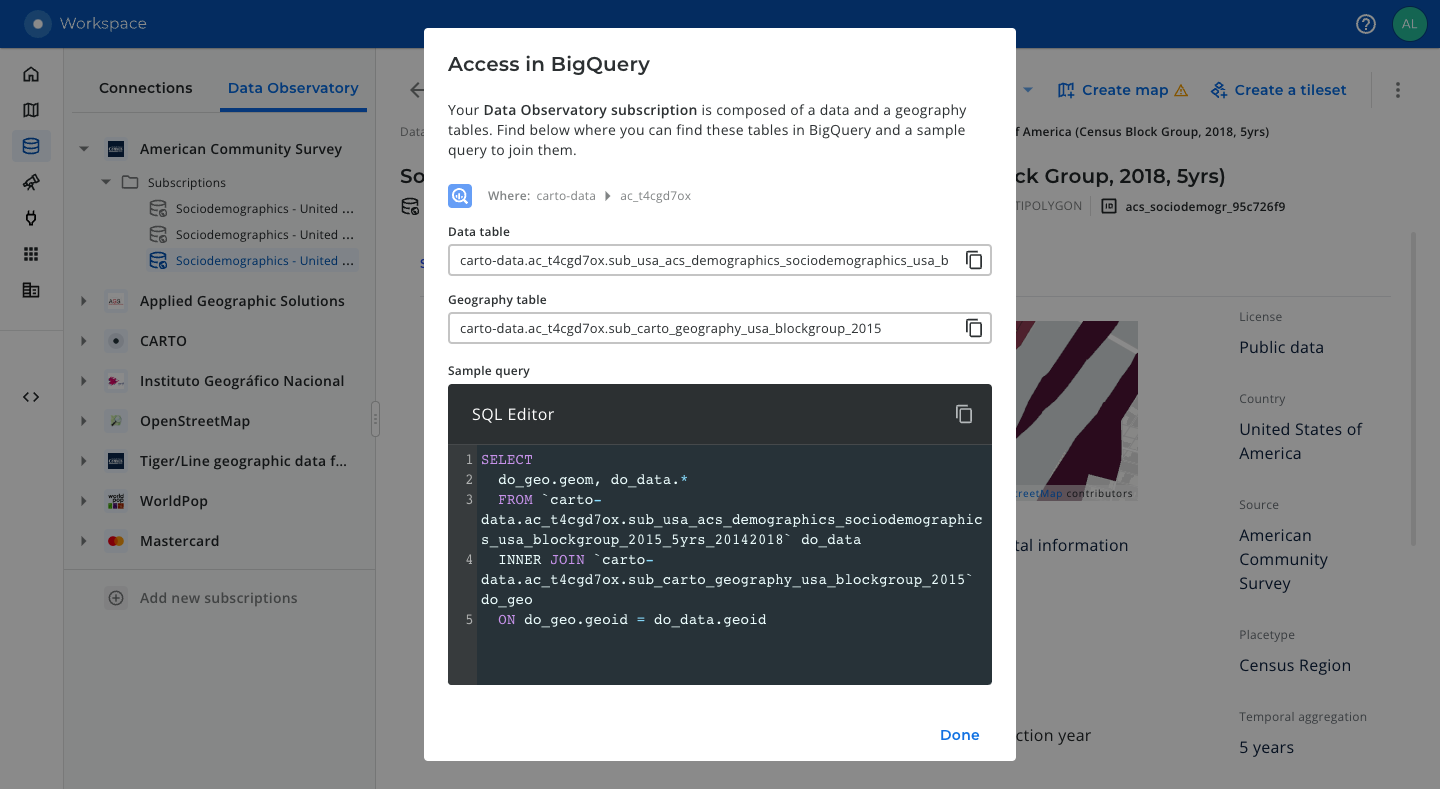
Navigate to the Data Explorer and expand the Data Observatory section. Choose any of the your data subscriptions and click on the “Access in” button on the top right of the page. Copy the BigQuery project and dataset from any of the table locations that you see on the screen.

Confirm that you can see all of your data subscriptions by running the command below, which makes use of the
DATAOBS_SUBSCRIPTIONSprocedure. Please replace the BigQuery project and dataset with those you copied in the previous step.

3. Choose variables for the enrichment
We can list all the variables (data columns) available in our Data Observatory subscriptions by running the following query, which makes use of the DATAOBS_SUBSCRIPTION_VARIABLES procedure. Please remember to replace the BigQuery project and dataset with those you used in the previous command.

In this particular example we are going to enrich our data with the following variables. Please note that these variables are uniquely identified by their variable_slug.
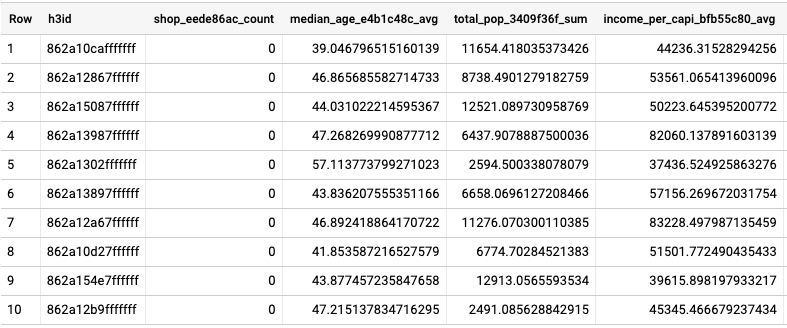
total_pop_3409f36f,median_age_e4b1c48candincome_per_capi_bfb55c80: these variables are from the ACS Sociodemographics dataset for the US, at Census Block Group level (2018). As we can see in thevariable_descriptioncolumn, they represent the total population, their median age and their per capita income in the past 12 months, respectively.shop_eede86ac. This variable is from the POIs dataset of OpenStreetMap for the US. When the POI is a shop, this variable contains the specific shop category, e.g. “supermarket”. It is NULL otherwise.
4. Run the enrichment
We are going to enrich an H3 grid of resolution 6 of the city of New York with the four Data Observatory variables chosen in the previous step. The data table is publicly available at cartobq.docs.nyc_boundary_h3z6 and it was created by leveraging the H3 polyfill function of the Analytics Toolbox, through the following query:
The enrichment is performed using the DATAOBS_ENRICH_GRID procedure of the Analytics Toolbox. Please note that this particular procedure makes use of spatial indexes and does not require the input data to have a geometry column.
The following inputs are needed:
The type of spatial index used, H3 in our case.
The input query to be enriched.
The name of the column containing valid H3 indexes.
The list of variables to be used for the enrichment and their aggregation method. As explained earlier, these variables are identified using their
variable_slug. For more information about the aggregation methods, please refer to the documentation.Name of the output table where the result of the enrichment will be stored.
Location of your Data Observatory subscriptions. This is the same
project.datasetwe used to run theDATAOBS_SUBSCRIPTIONSandDATAOBS_SUBSCRIPTION_VARIABLESin previous steps of this guide.

5. Analyze the enrichment result
The table resulting from running the previous query, publicly available at cartobq.docs.nyc_boundary_h3z6_enriched, will include all the columns of the input query plus four additional columns, containing the value of each enrichment variable in each H3 cell. As shown below, the enrichment result can be analyzed with the help of a map and a set of interactive widgets created using Builder, our map making tool available from the CARTO Workspace.
To get started creating maps, we recommend the following resources from the documentation:
Guide to create your first map.
Guide to add widgets to a map.
Step-by-step tutorial to create a category and bubbles visualization, leveraging different map styles and widgets.
Last updated
Was this helpful?

