An H3 grid of Starbucks locations and simple cannibalization analysis
Building the H3 grid
We are going to demonstrate how fast and easy it is to make a visualization of an H3 grid to identify the concentration of Starbucks locations in the US.
The first step is to import the Starbucks locations dataset into a BigQuery table called starbucks_locations_usa. If you want to skip this step, you can use the publicly available table cartobq.docs.starbucks_locations_usa instead. Then, with a single query, we are going to calculate how many Starbucks locations fall within each H3 grid cell of resolution 4.
WITHdataAS (SELECT`carto-un`.carto.H3_FROMGEOGPOINT(geog, 4) AS h3id,COUNT(*) AS agg_totalFROM`cartobq.docs.starbucks_locations_usa`GROUP BY h3id )SELECT h3id, agg_total,`carto-un-eu`.carto.H3_BOUNDARY(h3id) AS geomFROMdata;
WITHdataAS (SELECT`carto-un-eu`.carto.H3_FROMGEOGPOINT(geog, 4) AS h3id,COUNT(*) AS agg_totalFROM`cartobq.docs.starbucks_locations_usa`GROUP BY h3id )SELECT h3id, agg_total,`carto-un-eu`.carto.H3_BOUNDARY(h3id) AS geomFROMdata;
WITHdataAS (SELECT carto.H3_FROMGEOGPOINT(geog, 4) AS h3id,COUNT(*) AS agg_totalFROM`cartobq.docs.starbucks_locations_usa`GROUP BY h3id )SELECT h3id, agg_total,`carto-un-eu`.carto.H3_BOUNDARY(h3id) AS geomFROMdata;
This query adds two new columns to our dataset: geom, representing the boundary of each of the H3 grid cells where there’s at least one Starbucks, and agg_total, containing the total number of locations that fall within each cell. Finally, we can visualize the result.
Note: this visualization is made using Builder, where you can easily import your BigQuery data using our connector, but you can also create a quick visualization using BigQuery Geo Viz.
Using finer resolution H3 for simple cannibalization analysis
Next, we will analyze in finer detail the grid cell that we have identified contains the highest concentration of Starbucks locations, with ID 8428d55ffffffff.
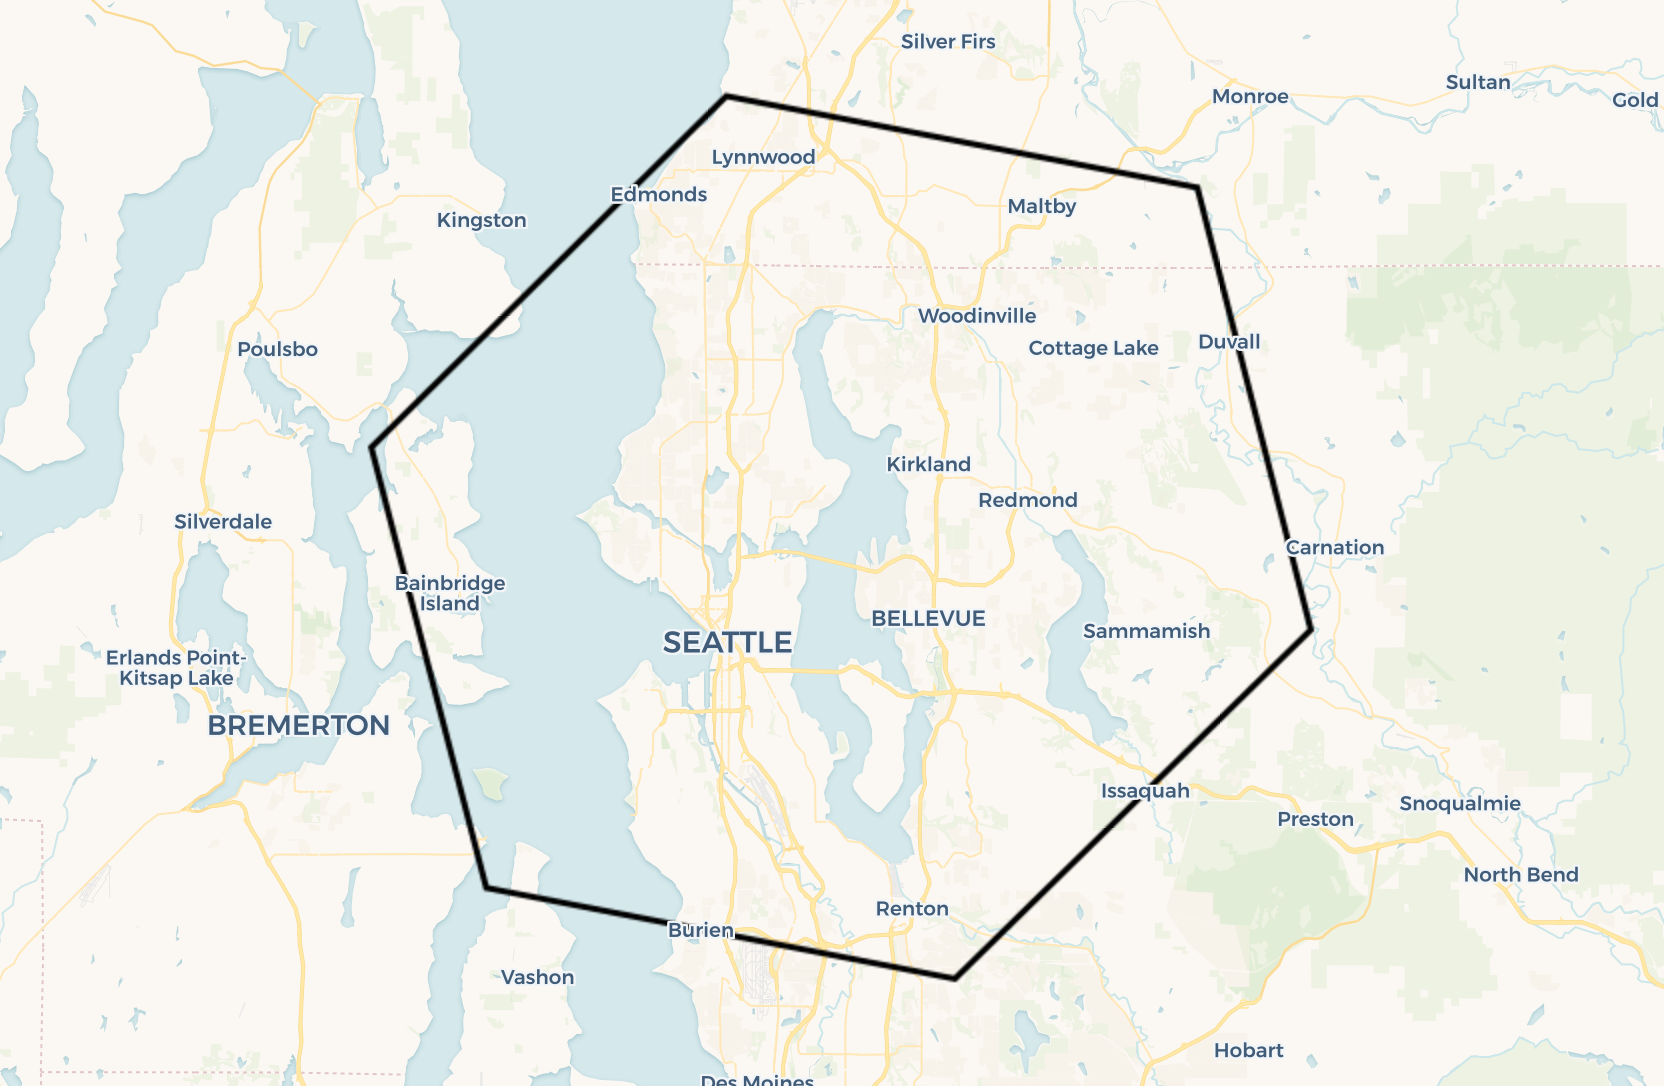
WITHdataAS (SELECT`carto-un`.carto.H3_FROMGEOGPOINT(geog, 9) AS h3id,COUNT(*) AS agg_totalFROM`cartobq.docs.starbucks_locations_usa`WHERE ST_INTERSECTS(geog,`carto-un`.carto.H3_BOUNDARY('8428d55ffffffff'))GROUP BY h3id )SELECT h3id, agg_total,`carto-un`.carto.H3_BOUNDARY(h3id) AS geomFROMdata;b
WITHdataAS (SELECT`carto-un-eu`.carto.H3_FROMGEOGPOINT(geog, 9) AS h3id,COUNT(*) AS agg_totalFROM`cartobq.docs.starbucks_locations_usa`WHERE ST_INTERSECTS(geog,`carto-un-eu`.carto.H3_BOUNDARY('8428d55ffffffff'))GROUP BY h3id )SELECT h3id, agg_total,`carto-un-eu`.carto.H3_BOUNDARY(h3id) AS geomFROMdata;
WITHdataAS (SELECT carto.H3_FROMGEOGPOINT(geog, 9) AS h3id,COUNT(*) AS agg_totalFROM`cartobq.docs.starbucks_locations_usa`WHERE ST_INTERSECTS(geog, carto.H3_BOUNDARY('8428d55ffffffff'))GROUP BY h3id )SELECT h3id, agg_total, carto.H3_BOUNDARY(h3id) AS geomFROMdata;
We can clearly identify that there are two H3 cells with the highest concentration of Starbucks locations, and therefore at risk of suffering cannibalization. These are cells with IDs 8928d542c17ffff and 8928d542c87ffff respectively. Finally, to complete our analysis, we can calculate how many locations are within one cell distance of this first cell:
WITHdataAS (SELECT`carto-un`.carto.H3_FROMGEOGPOINT(geog, 9) AS h3id,COUNT(*) AS agg_totalFROM`cartobq.docs.starbucks_locations_usa`WHERE ST_INTERSECTS(geog,`carto-un`.carto.H3_BOUNDARY('8428d55ffffffff'))GROUP BY h3id )SELECTSUM(agg_total)FROMdataWHERE h3id IN UNNEST(`carto-un`.carto.H3_KRING('8928d542c17ffff', 1));-- 13
WITHdataAS (SELECT`carto-un-eu`.carto.H3_FROMGEOGPOINT(geog, 9) AS h3id,COUNT(*) AS agg_totalFROM`cartobq.docs.starbucks_locations_usa`WHERE ST_INTERSECTS(geog,`carto-un-eu`.carto.H3_BOUNDARY('8428d55ffffffff'))GROUP BY h3id )SELECTSUM(agg_total)FROMdataWHERE h3id IN UNNEST(`carto-un-eu`.carto.H3_KRING('8928d542c17ffff', 1));-- 13
WITHdataAS (SELECT carto.H3_FROMGEOGPOINT(geog, 9) AS h3id,COUNT(*) AS agg_totalFROM`cartobq.docs.starbucks_locations_usa`WHERE ST_INTERSECTS(geog, carto.H3_BOUNDARY('8428d55ffffffff'))GROUP BY h3id )SELECTSUM(agg_total)FROMdataWHERE h3id IN UNNEST(carto.H3_KRING('8928d542c17ffff', 1));-- 13
Last updated
This project has received funding from the European Union’s Horizon 2020 research and innovation programme under grant agreement No 960401.