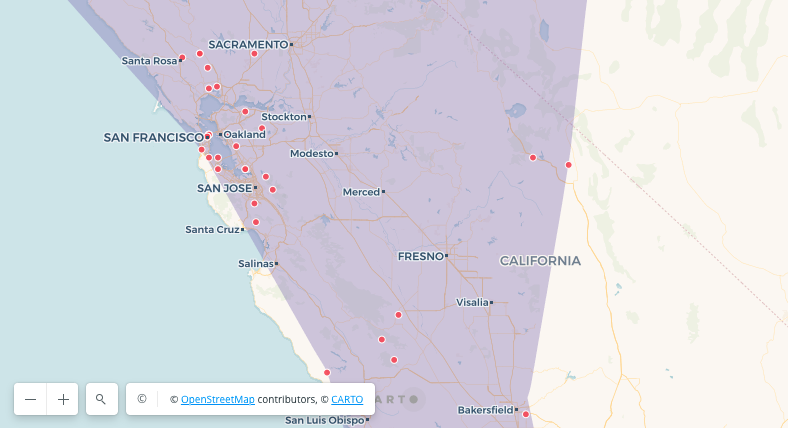
Identifying earthquake-prone areas in the state of California

WITH bounds AS (
    SELECT `carto-un`.carto.ST_MAKEENVELOPE(-126.98746757203217, 31.72298737861544, -118.1856191911019, 40.871240645013735) AS bbox
),
data AS (
    SELECT ST_GEOGPOINT(longitude, latitude) AS points
    FROM `bigquery-public-data`.noaa_significant_earthquakes.earthquakes
    JOIN bounds
    ON ST_CONTAINS(bounds.bbox, ST_GEOGPOINT(longitude, latitude))
    WHERE longitude IS NOT NULL AND latitude IS NOT NULL
),
bezier_spline AS (
    SELECT `carto-un`.carto.ST_BEZIERSPLINE(
        ST_BOUNDARY(
        `carto-un`.carto.ST_CONCAVEHULL(ARRAY_AGG(points), 300, "kilometres")),
        null,
        0.9) AS geom
    FROM data
),
polygon_array AS (
    SELECT `carto-un`.carto.ST_POLYGONIZE(ARRAY_AGG(geom)) AS geom
    FROM bezier_spline
)
SELECT unnested FROM polygon_array, UNNEST(geom) AS unnested;
Last updated
Was this helpful?


