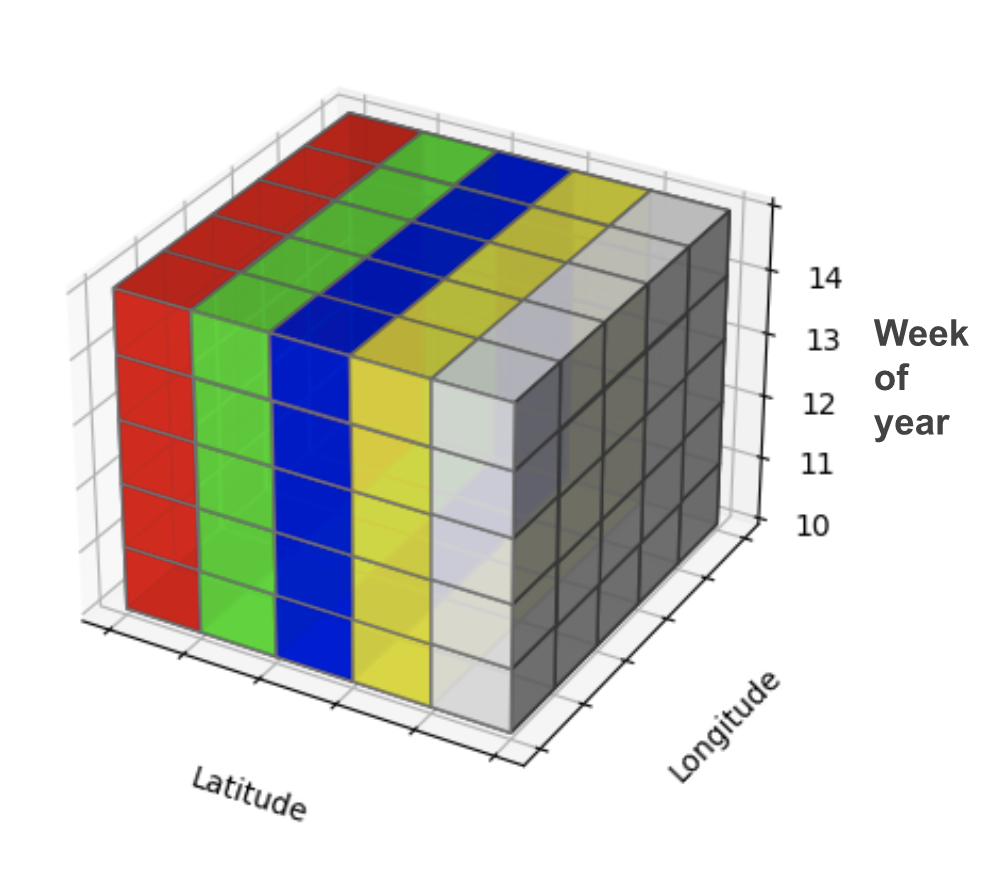
Space-time hotspot analysis: Identifying traffic accident hotspots

Spatiotemporal analysis plays a crucial role in extracting meaningful insights from data that possess both spatial and temporal components. By incorporating spatial information, such as geographic coordinates, with temporal data, such as timestamps, spatiotemporal analysis unveils dynamic behaviors and dependencies across various domains. This applies to different industries and use cases like car sharing and micro-mobility planning, urban planning, transportation optimization, and more.
In this example, we will perform space temporal analysis to identify traffic accident hotspots using the location and time of accidents in the city of Barcelona in 2018.
Requirements
To run this example you'll need:
An active CARTO organization
The latest version of the Analytics Toolbox Advanced installed in your Snowflake database
CARTO Academy - Data for tutorials and examples from Snowflake's Marketplace. With this free listing, users can access a set of sample tables with geospatial data that can be used to test and evaluate the CARTO geospatial analytics platform running natively on Snowflake
Guide
Step 1. Get the data ready
The dataset can be found in CARTO_ACADEMY_DATA.CARTO.BCN_ACCIDENTS_2018. For the purpose of this analysis, only the location and time of accidents are relevant. The table below shows an extraction of 10 of these accidents.

In addition, the map below shows all accidents in the city of Barcelona in 2018.
On the top map, the exact locations of the accidents are shown, while on the bottom one, the aggregated number of accidents per H3 cell at resolution 9 is displayed. On the widgets panel, the number of accidents over time is shown, where a periodicity can be observed.
Step 2. Generate space-time bins
The next step is to bucketize the data in space bins and time intervals. For this example, a spatial index H3 at resolution 9 and weekly time intervals were chosen. The data is aggregated by H3 cell and week. This can be achieved with the following code:

Step 3. Perform space-time hotspot analysis
Now let us use the spacetime Getis Ord Gi* function to calculate the z-score for each H3 cell and week. For that purpose, we will use the GETIS_ORD_SPACETIME_H3 function of the Analytics Toolbox.
This function needs the following inputs:
A table with the h3 cells and their corresponding date-time and number of accidents (
input).A table's fully qualified name to save results (
output_table).The name of the column with the h3 indexes (
index_col).The name of the column with the date (
date_col).The name of the column with the values to use for the spacetime Getis-Ord computation (
value_col).The size of the k-ring (
size). This is the spatial lag used for computing the corresponding Gi* statistic. In our case, we will take 1 ring around each h3 cell.The time unit (
time_freq). Equivalent to the h3 resolution for space aggregationtime_freqis the time aggregation we will use. We select week as our unit of time aggregation.The size of the time bandwidth (
time_bw). This determines the neighboring weeks to be considered for calculating the corresponding Gi* statistic. For this example, we will take 2 weeks, i.e., for every week, we consider the two prior and the two posterior weeks as neighbors.The kernel functions to be used for spatial (
kernel) and time weights (kernel_time). For this example, we use uniform kernel for space and quartic kernel for time.
And returns a table with the following schema:
index: H3 spatial index at the provided resolution, same as inputdate: date-time at the provided resolution, same as inputgi: the z-scorep-value: The two-tail p-value
Running the following, we compute the Getis Ord Gi* for each H3 cell and week. It is saved in your own table MYDB.MYSCHEMA.BCN_ACCIDENTS_COUNT_GRID_STGI.
Step 4. Getting cold and hotspots
We can now filter the previous table to keep only the rows whose p value is less or equal than 5% and gi positive. This results in keeping only the cells and weeks which are considered as hotspots. Respectively, for coldspots, we need to filter the p value to be less or equal than 5% and gi negative. Then we aggregate per H3 cells to get the number of weeks in which every cell is considered to be a hotspot.
The output is shown in the following map, and the number of weeks per cell with a significantly high number of accidents is shown.
 This project has received funding from the European Union’s Horizon 2020 research and innovation programme under grant agreement No 960401.
Last updated
Was this helpful?

