Creating spatial index tilesets

We provide a set of examples that showcase how to easily create simple tilesets allowing you to process and visualize very large spatial datasets stored in BigQuery. You should use this procedure if you have a dataset that contains a column with a spatial index identifier instead of a geometry and you want to visualize it at an appropriate zoom level.
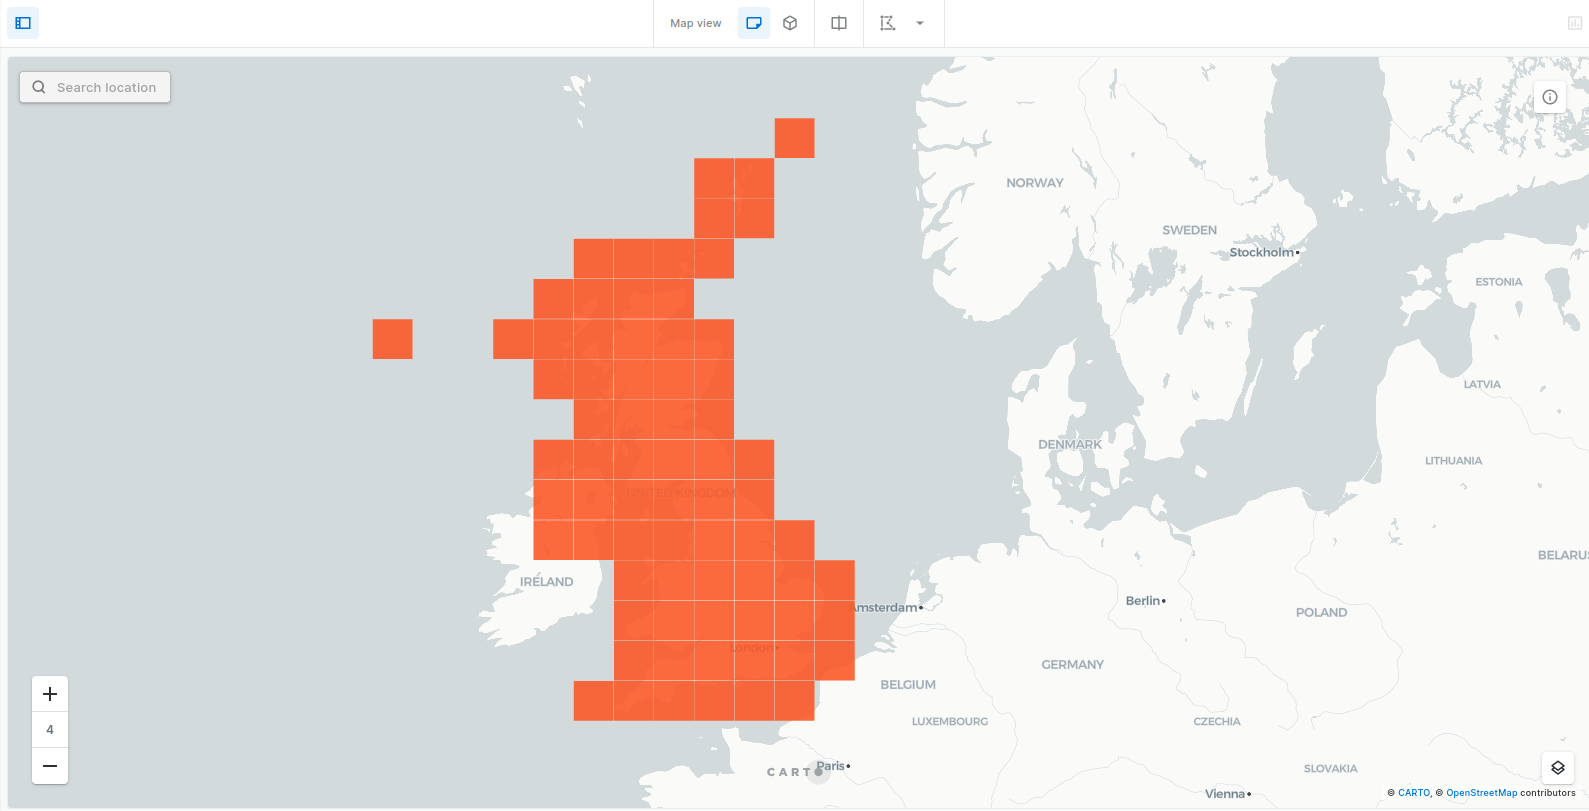
Tileset from UK Spatial Features Quadbin dataset
In this example we are creating a tileset with population values from a UK Spatial Features dataset that contains a geoid column with Quadbin ids. The dataset if publicly available in the CARTO Data Observatory.
The dataset is divided in two tables: one with the data and the spatial index ids, and another one with those ids and the corresponding polygon geometries. The procedure that creates the tileset does not require any geometry, and only uses the spatial index ids, so there is no need to use both tables or join them beforehand. Instead, the data table is passed to the procedure as input table.
Population for each cell is stored in a column named population. We will use a sum function to aggregate population values in the different levels of the tileset. The aggregated values will be stored in a column with that same name.
The query used to produce the tileset is the following:

Tileset from UK Spatial Features H3 dataset
A version of the UK Spatial Features dataset that uses H3 instead of Quadbin is also available.
The following query can be used to create a tileset similar to the one described in the example above, but using H3 cells:
Last updated
Was this helpful?

