Calculate population living around top retail locations

In this example we will create drive-time isolines for selected retail locations and we will then enrich them with population data leveraging the power of the H3 spatial index. This tutorial includes some examples of simple data manipulation, including filtering, ordering and limiting datasets, plus some more advanced concepts such as polyfiling areas with H3 cells and joining data using a spatial index.
As input data we will leverage a point-based dataset representing retail location that is available in the demo data accessible from the CARTO Data Warehouse connection (i.e. retail_stores), and a table with data from CARTO's Spatial Feature dataset in the USA aggregated at H3 Resolution 8 (i.e. derived_spatialfeatures_usa_h3res8_v1_yearly_v2).
Let's get to it!
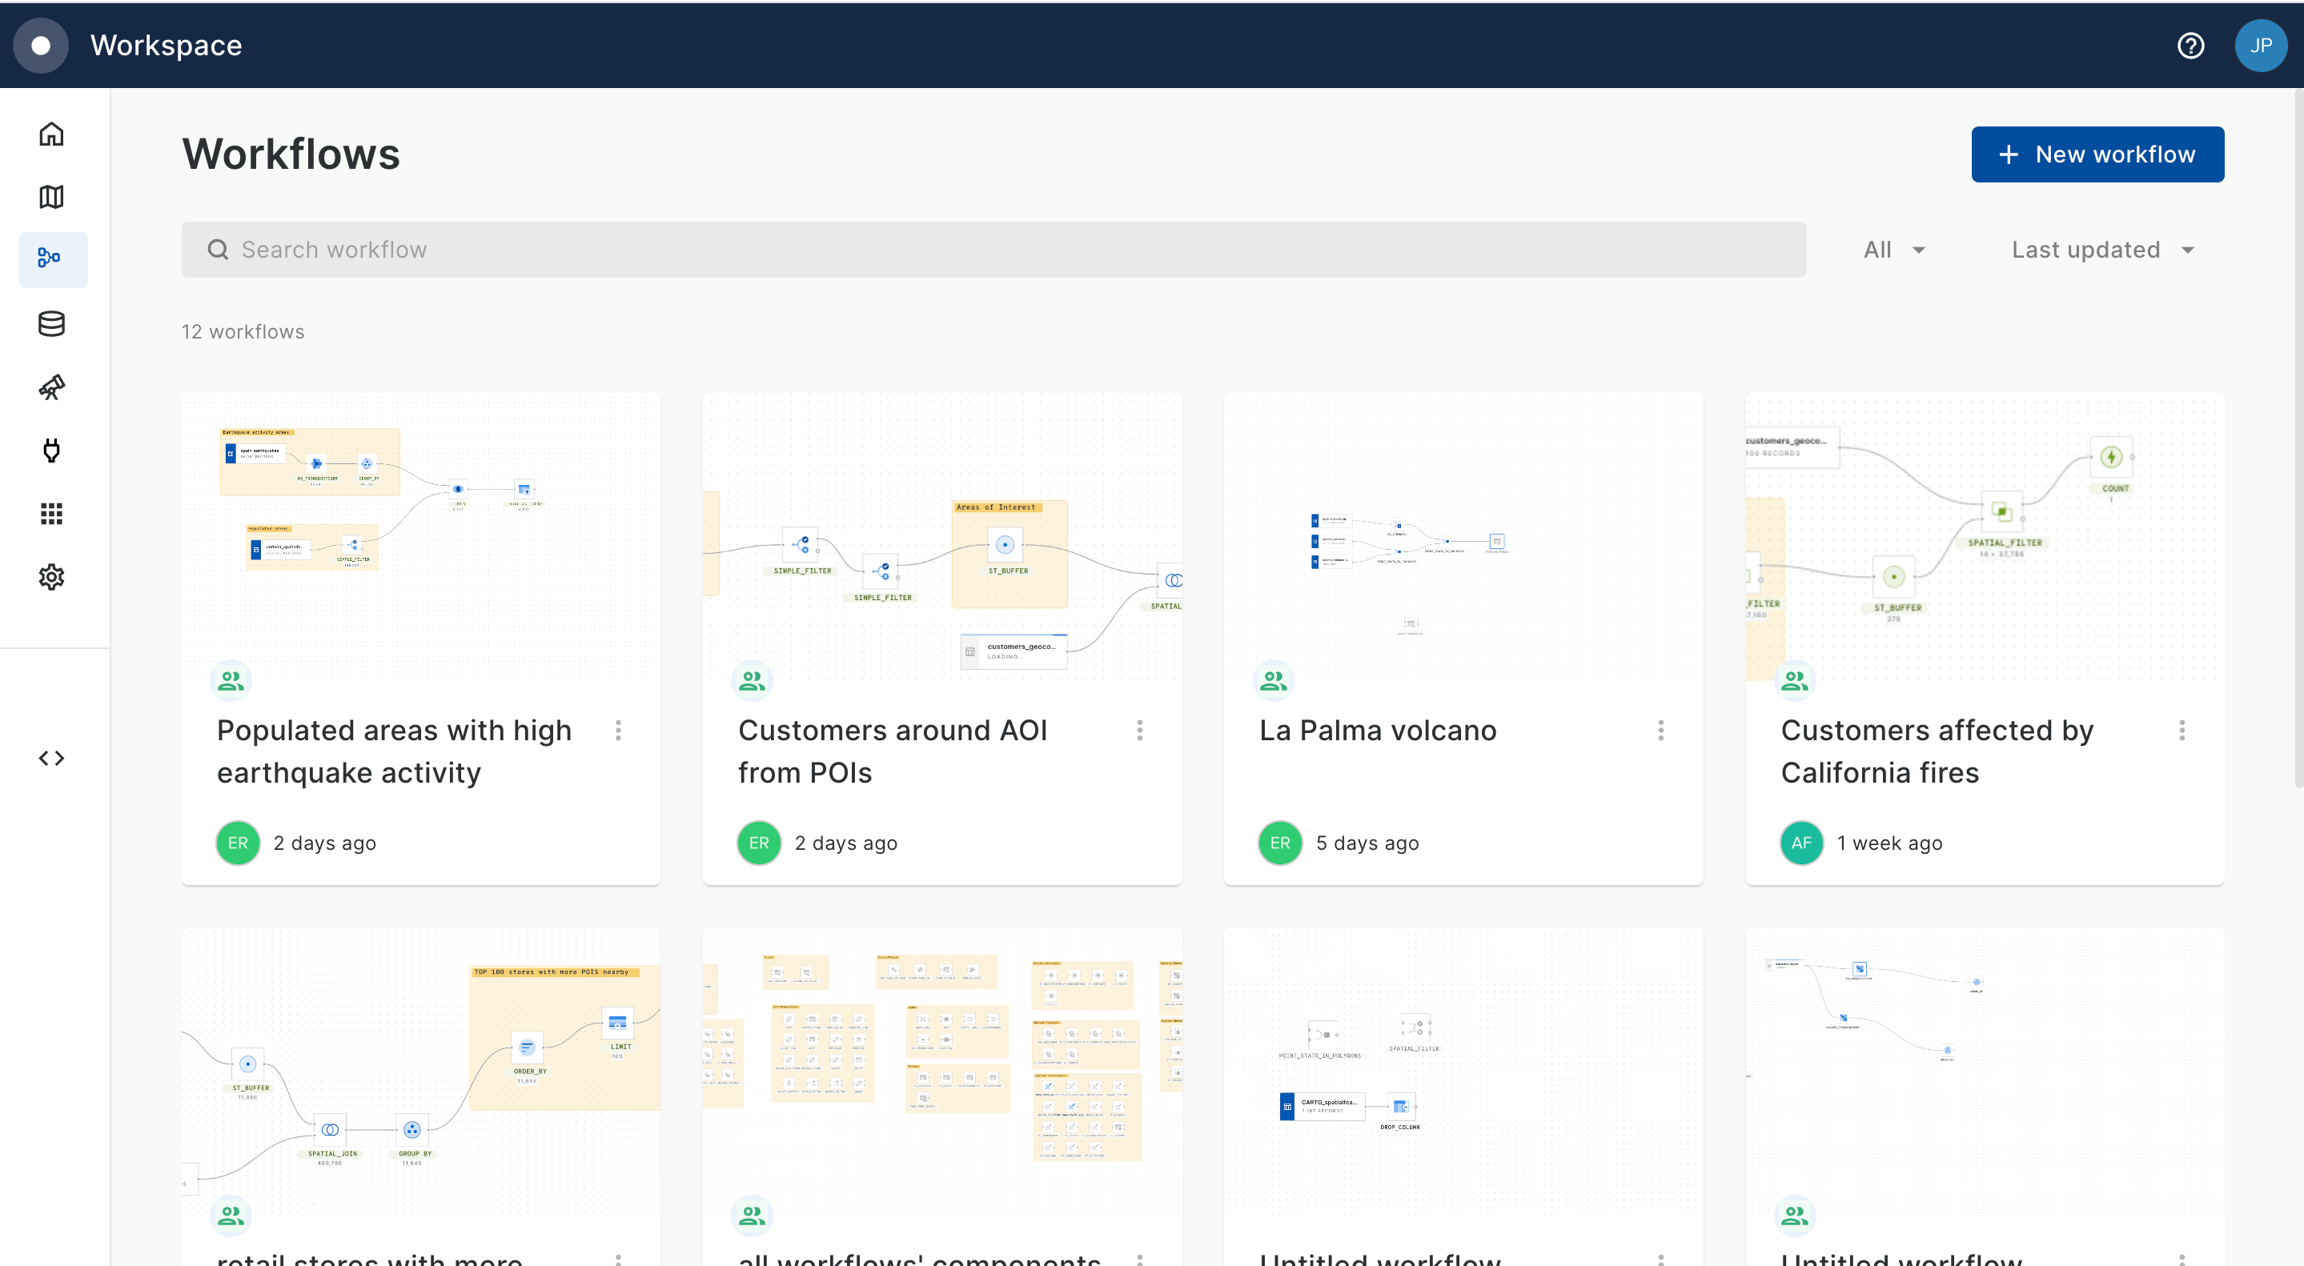
Creating a workflow and loading your point data
In your CARTO Workspace under the Workflows tab, create a new workflow.
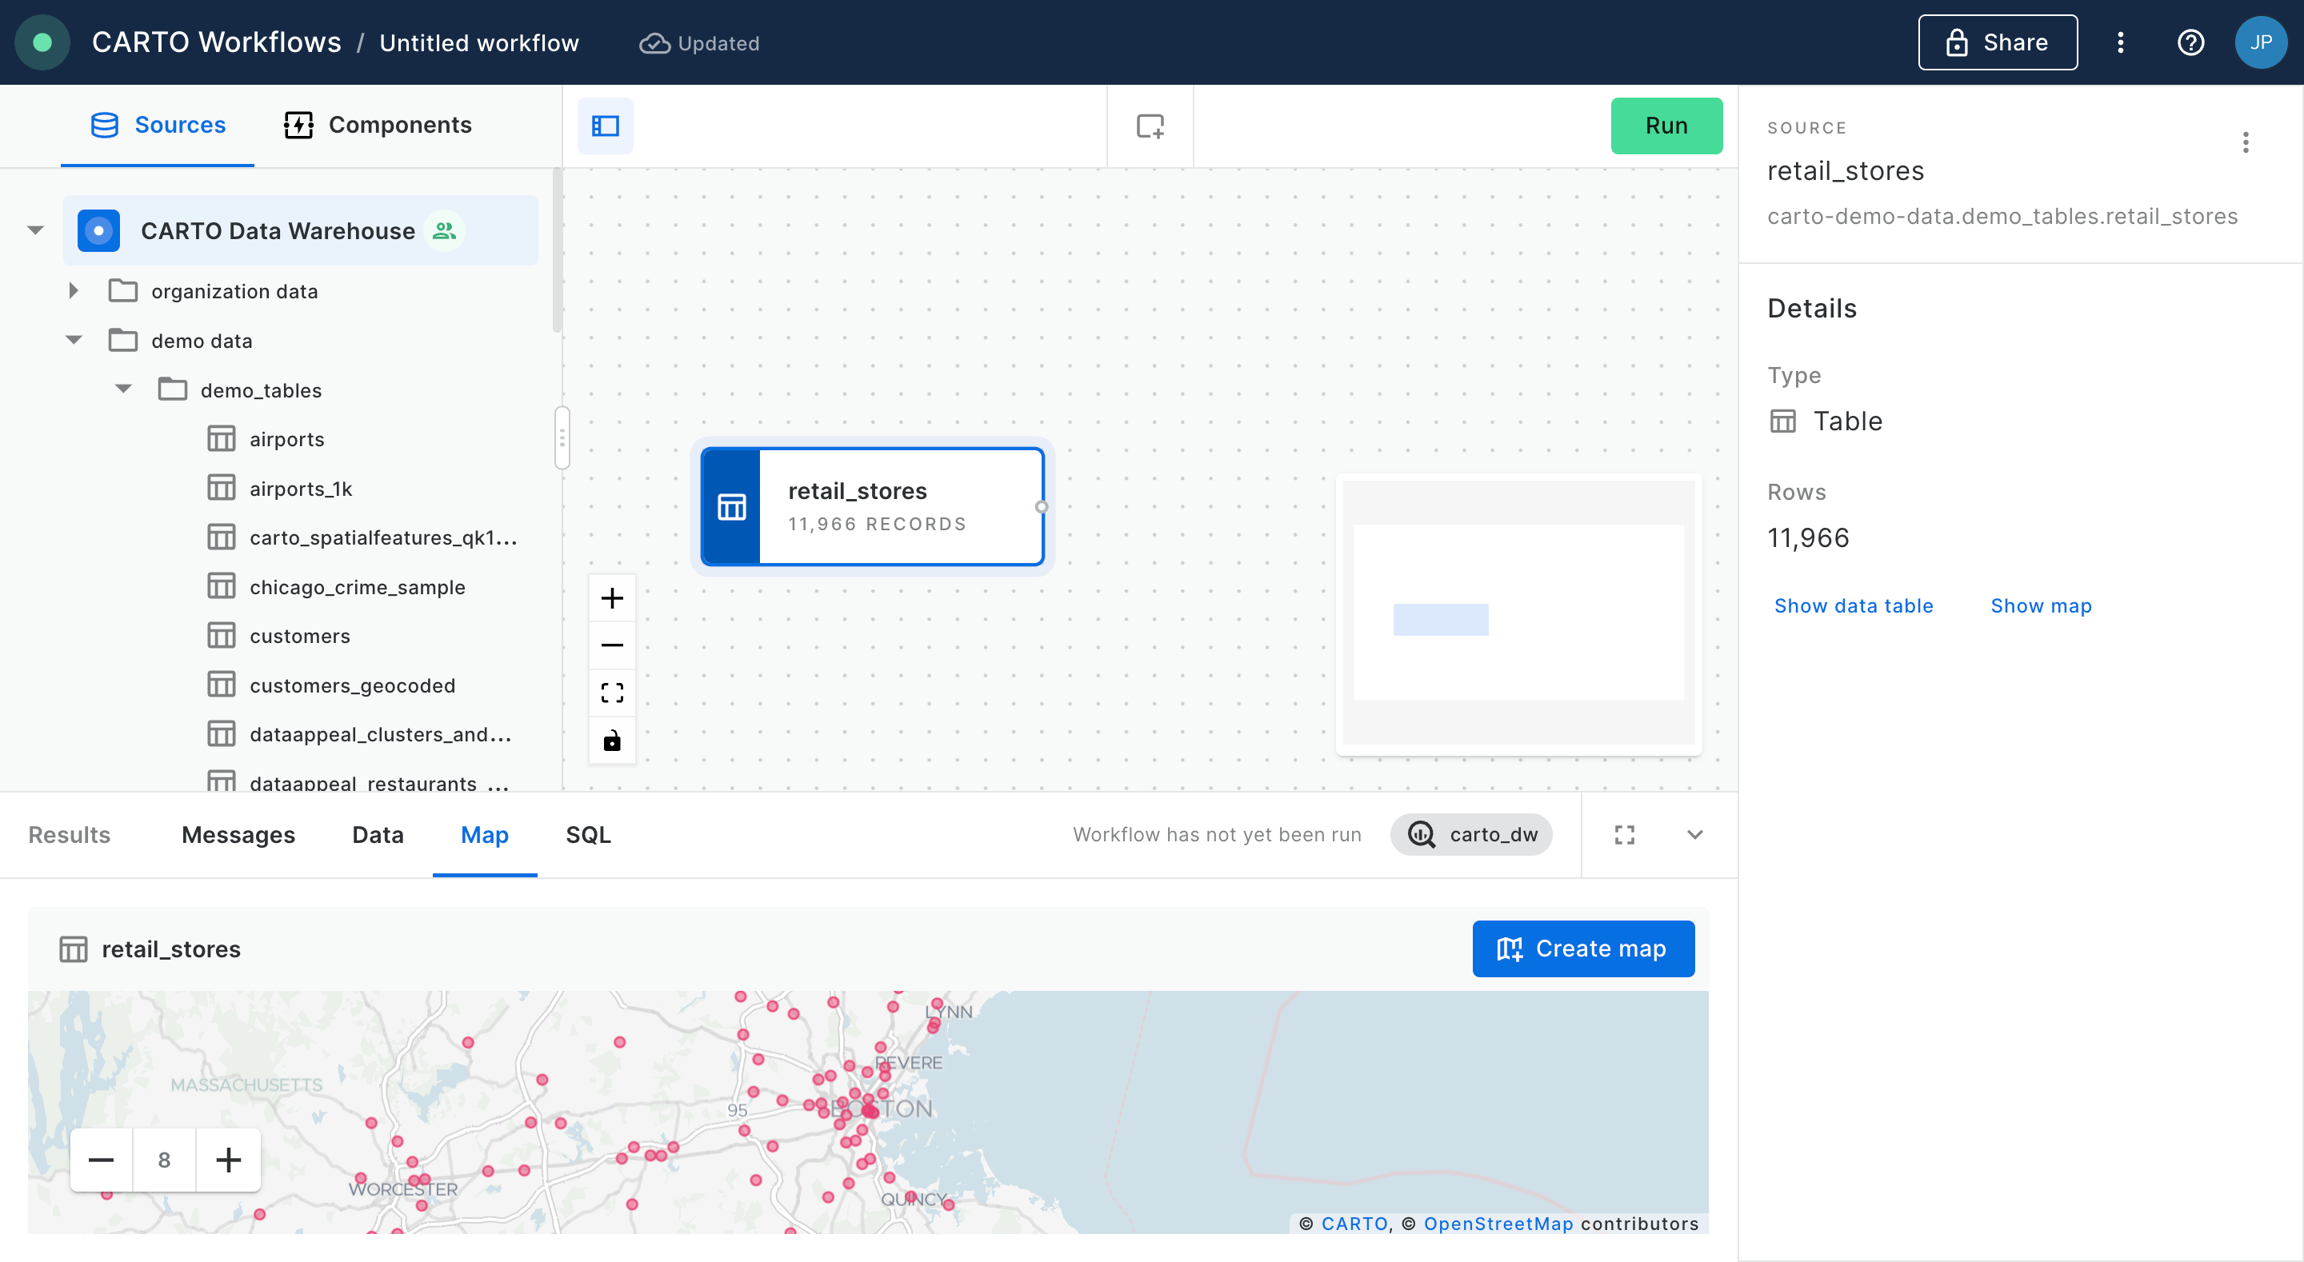
Select the data warehouse where you have the table with the point data accessible. We'll be using the CARTO Data Warehouse, which should be available to all users.
Navigate the data sources panel to locate your table, and drag it onto the canvas. In this example we will be using the
retail_storestable available in demo data. You should be able to preview the data both in tabular and map format.
Selecting relevant stores
In this example, we want to select the 100 stores with the highest revenue, our top performing locations.
First, we want to eliminate irrelevant store types. Drag the Select Distinct component from the Data Preparation toolbox onto the canvas. Connect the stores source to the input side of this component (the left side) and change the column type to storetype.
Click run.
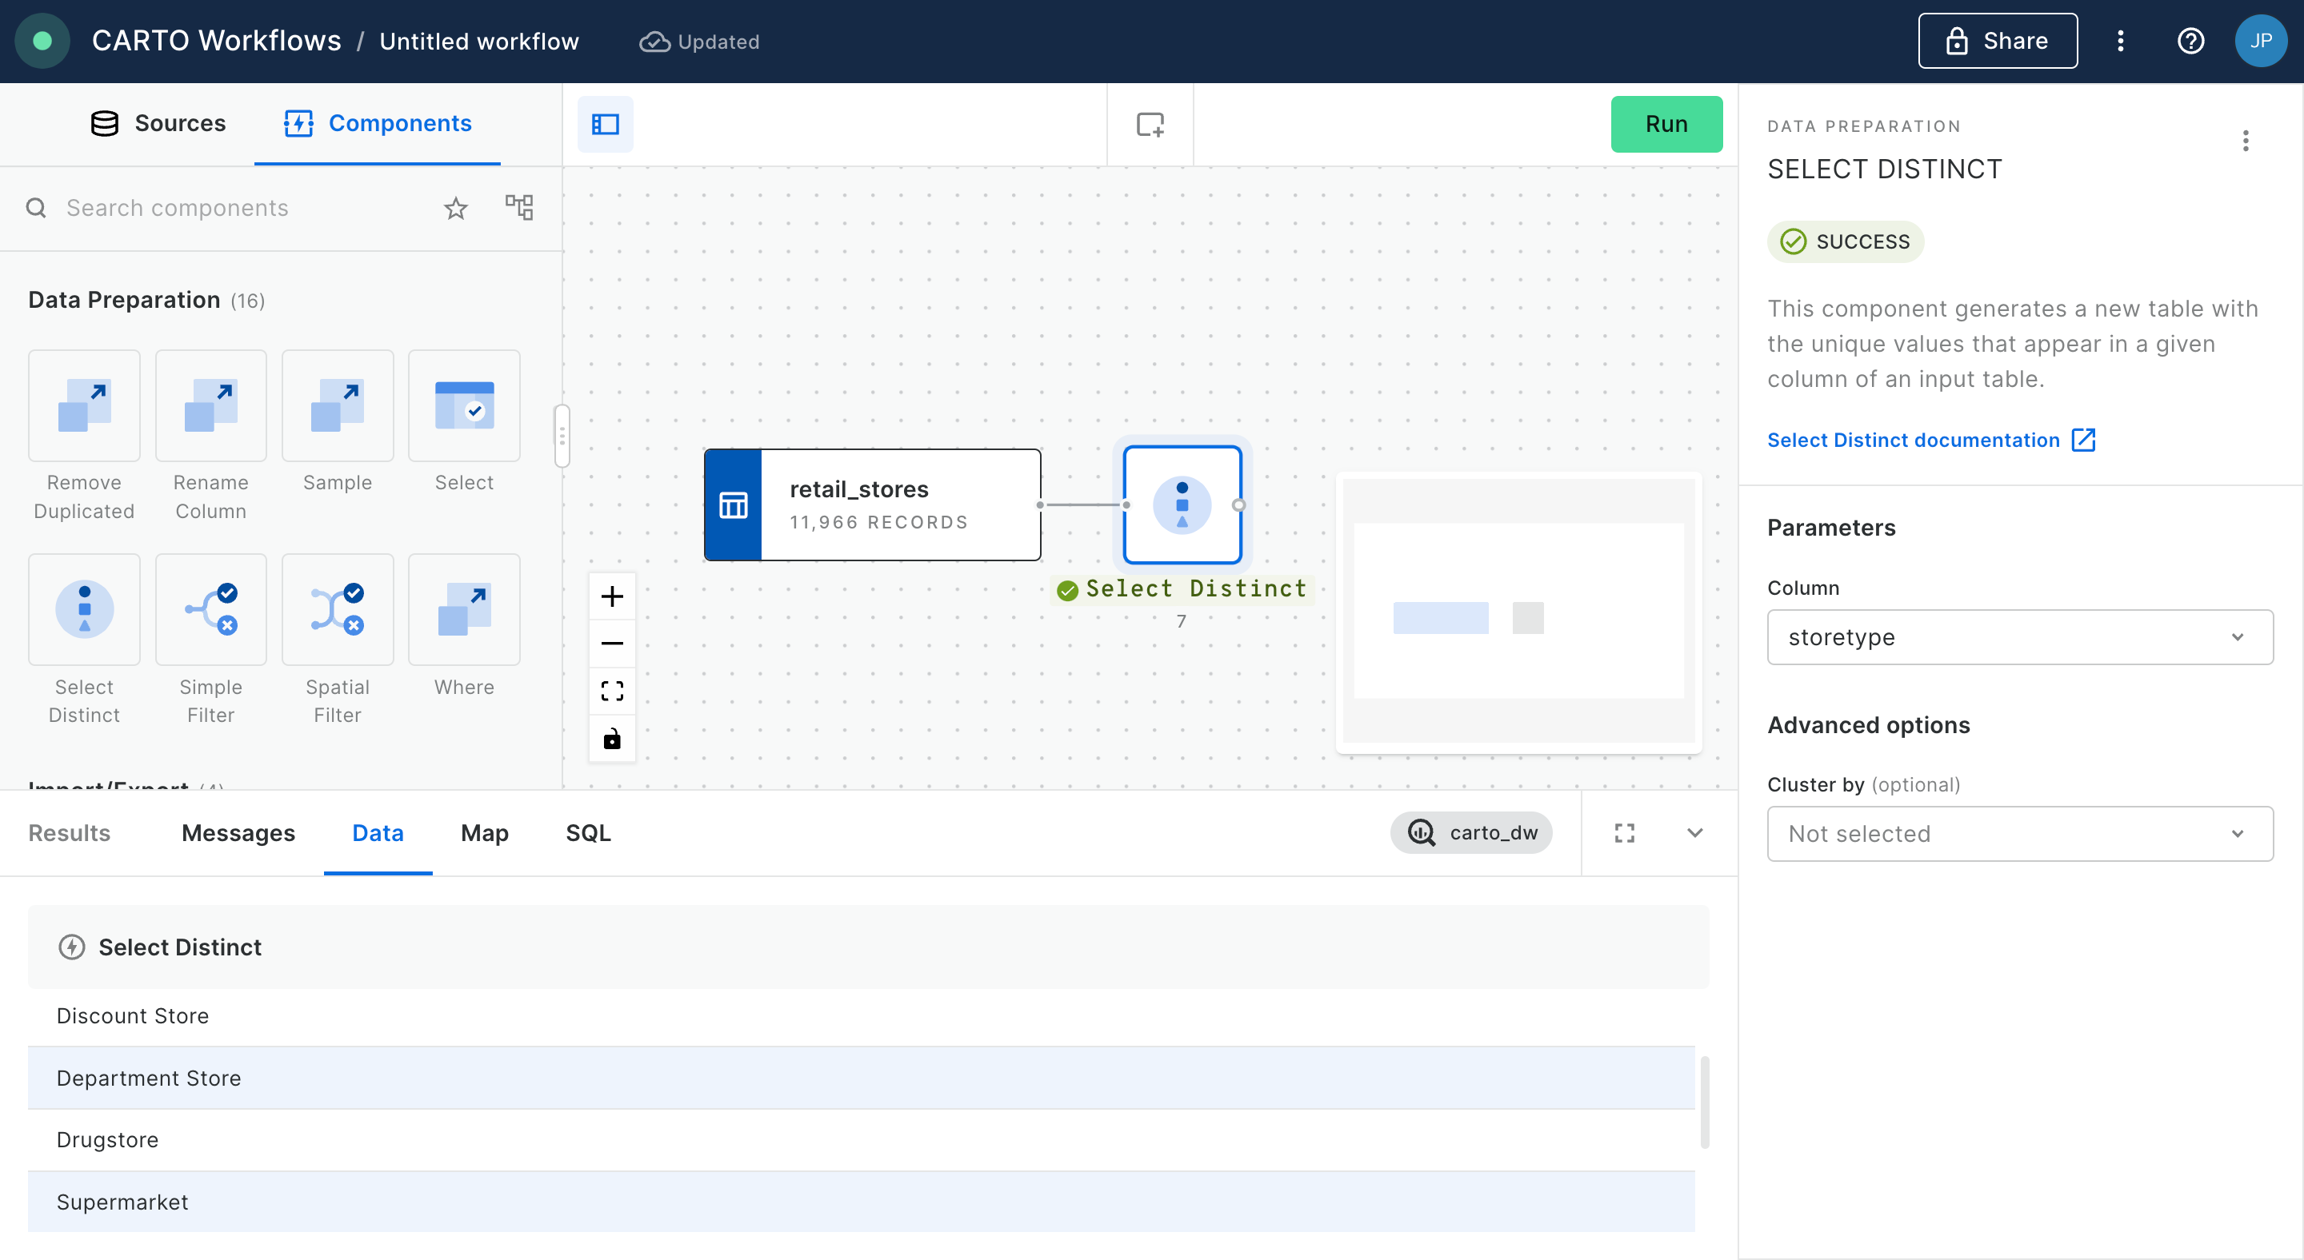
Once run, click on the Select Distinct component and switch to the data preview at the bottom of the window. You will see a list of all distinct store type values. In this example, let’s say we’re only interested in supermarkets.
To select supermarkets, add a Simple Filter component from the Data Preparation toolbox.
Connect the retail stores to the filter, and specify the column as storetype, the operator as equal to, and the value as Supermarket (it's case sensitive).
Run!
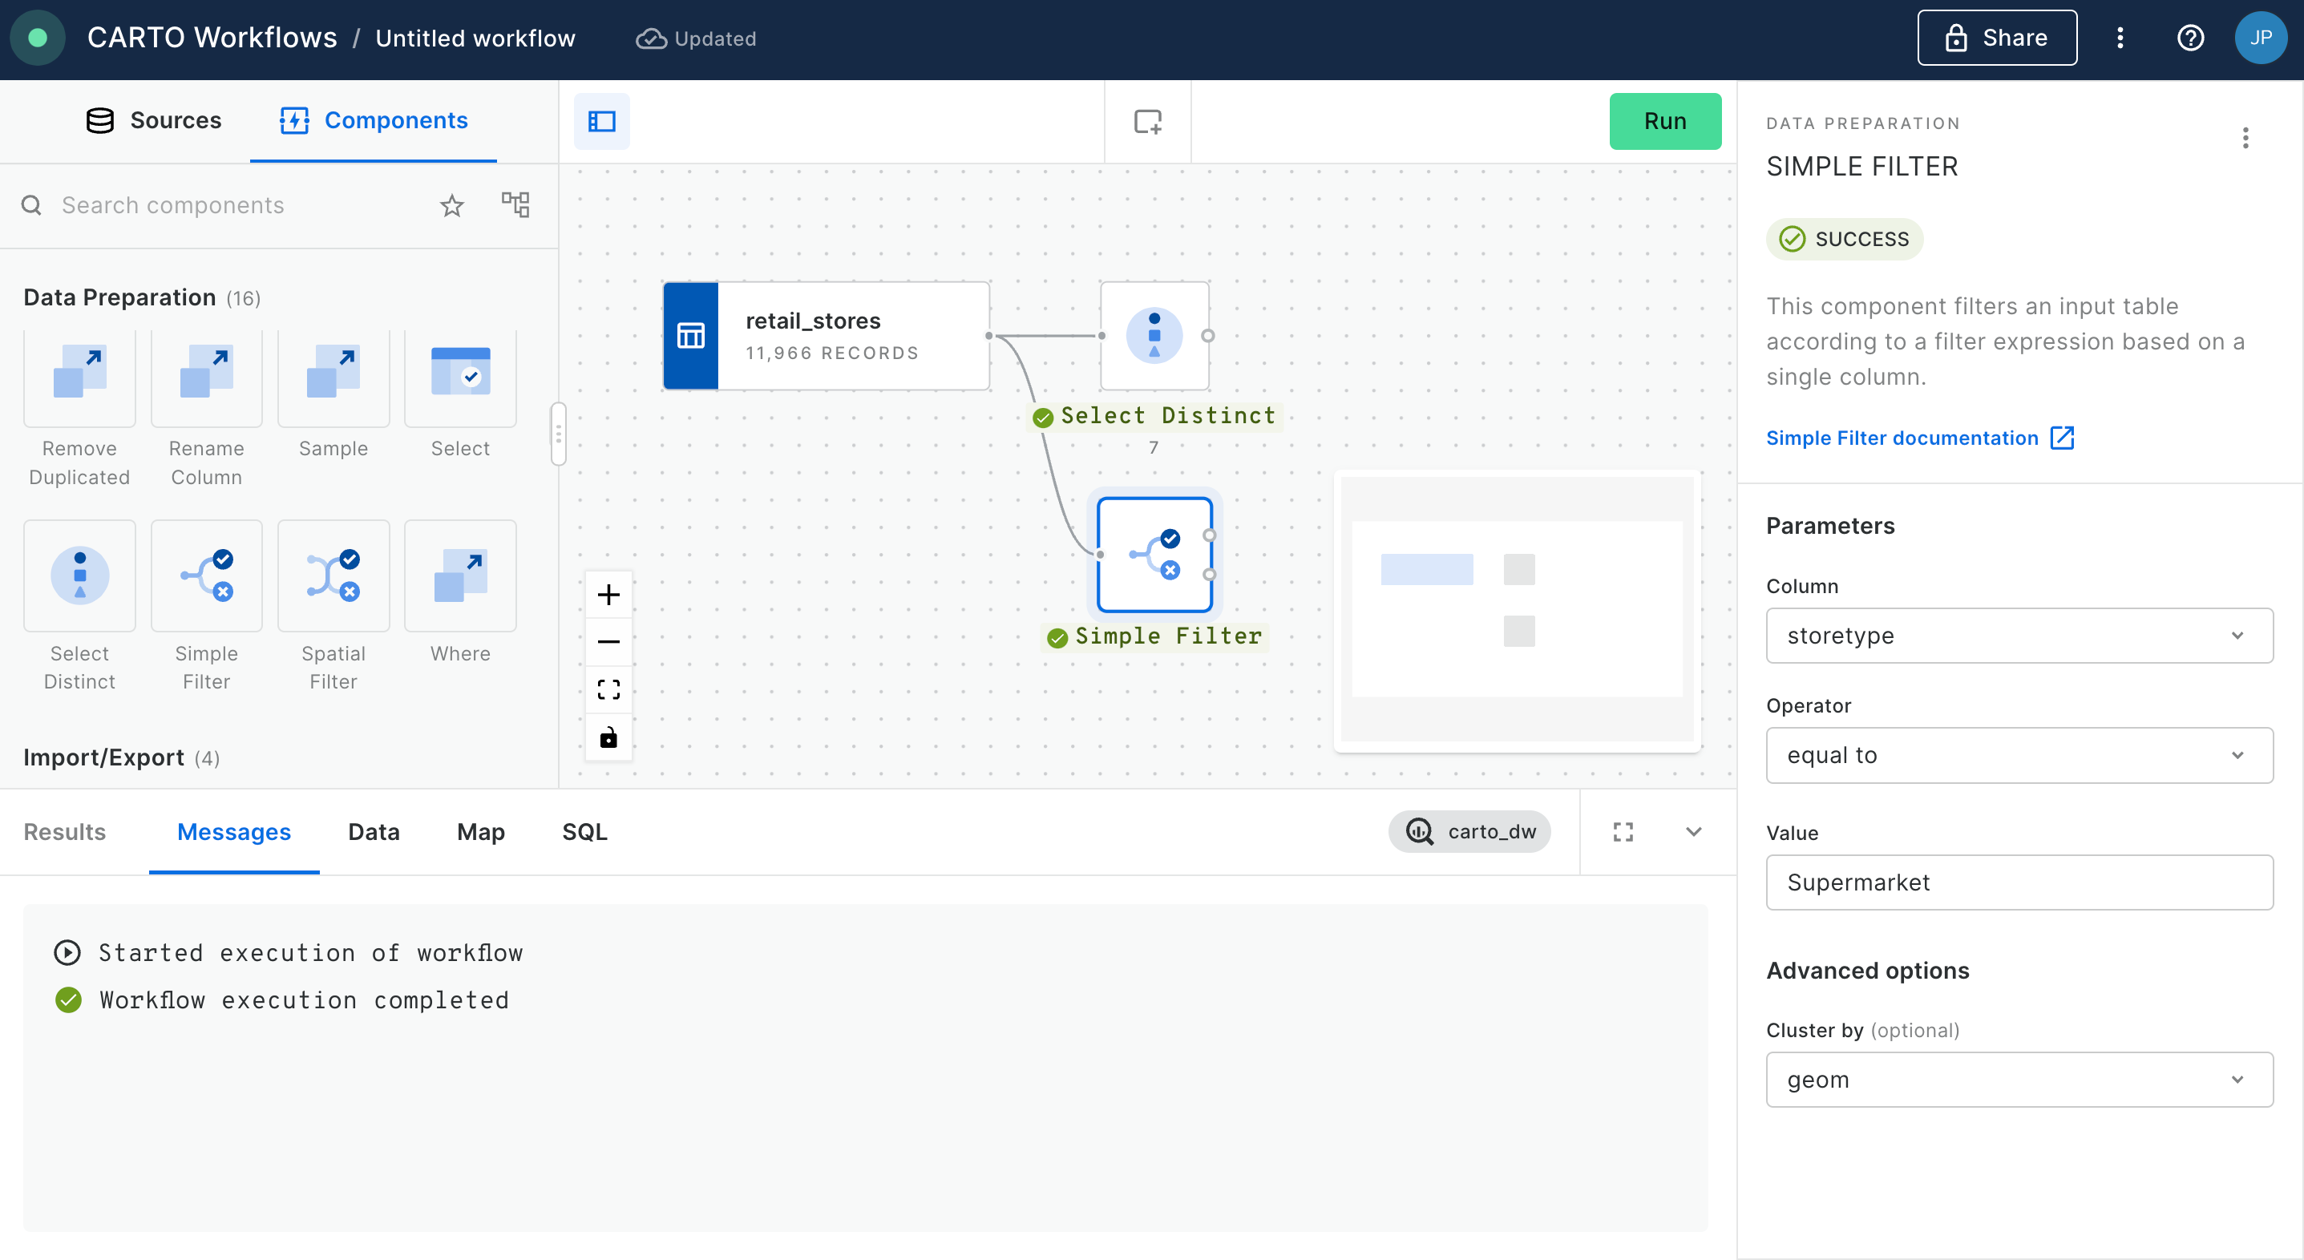
This leaves us with 10,202 stores. The next step is to select the top 100 stores in terms of revenue.
Add an Order By component from the Data Preparation toolbox and connect it to the top output from Simple Filter. Note that the top output is all features which match the filter, and the bottom is all of those which don't.
Change the column to revenue and the order to descending.
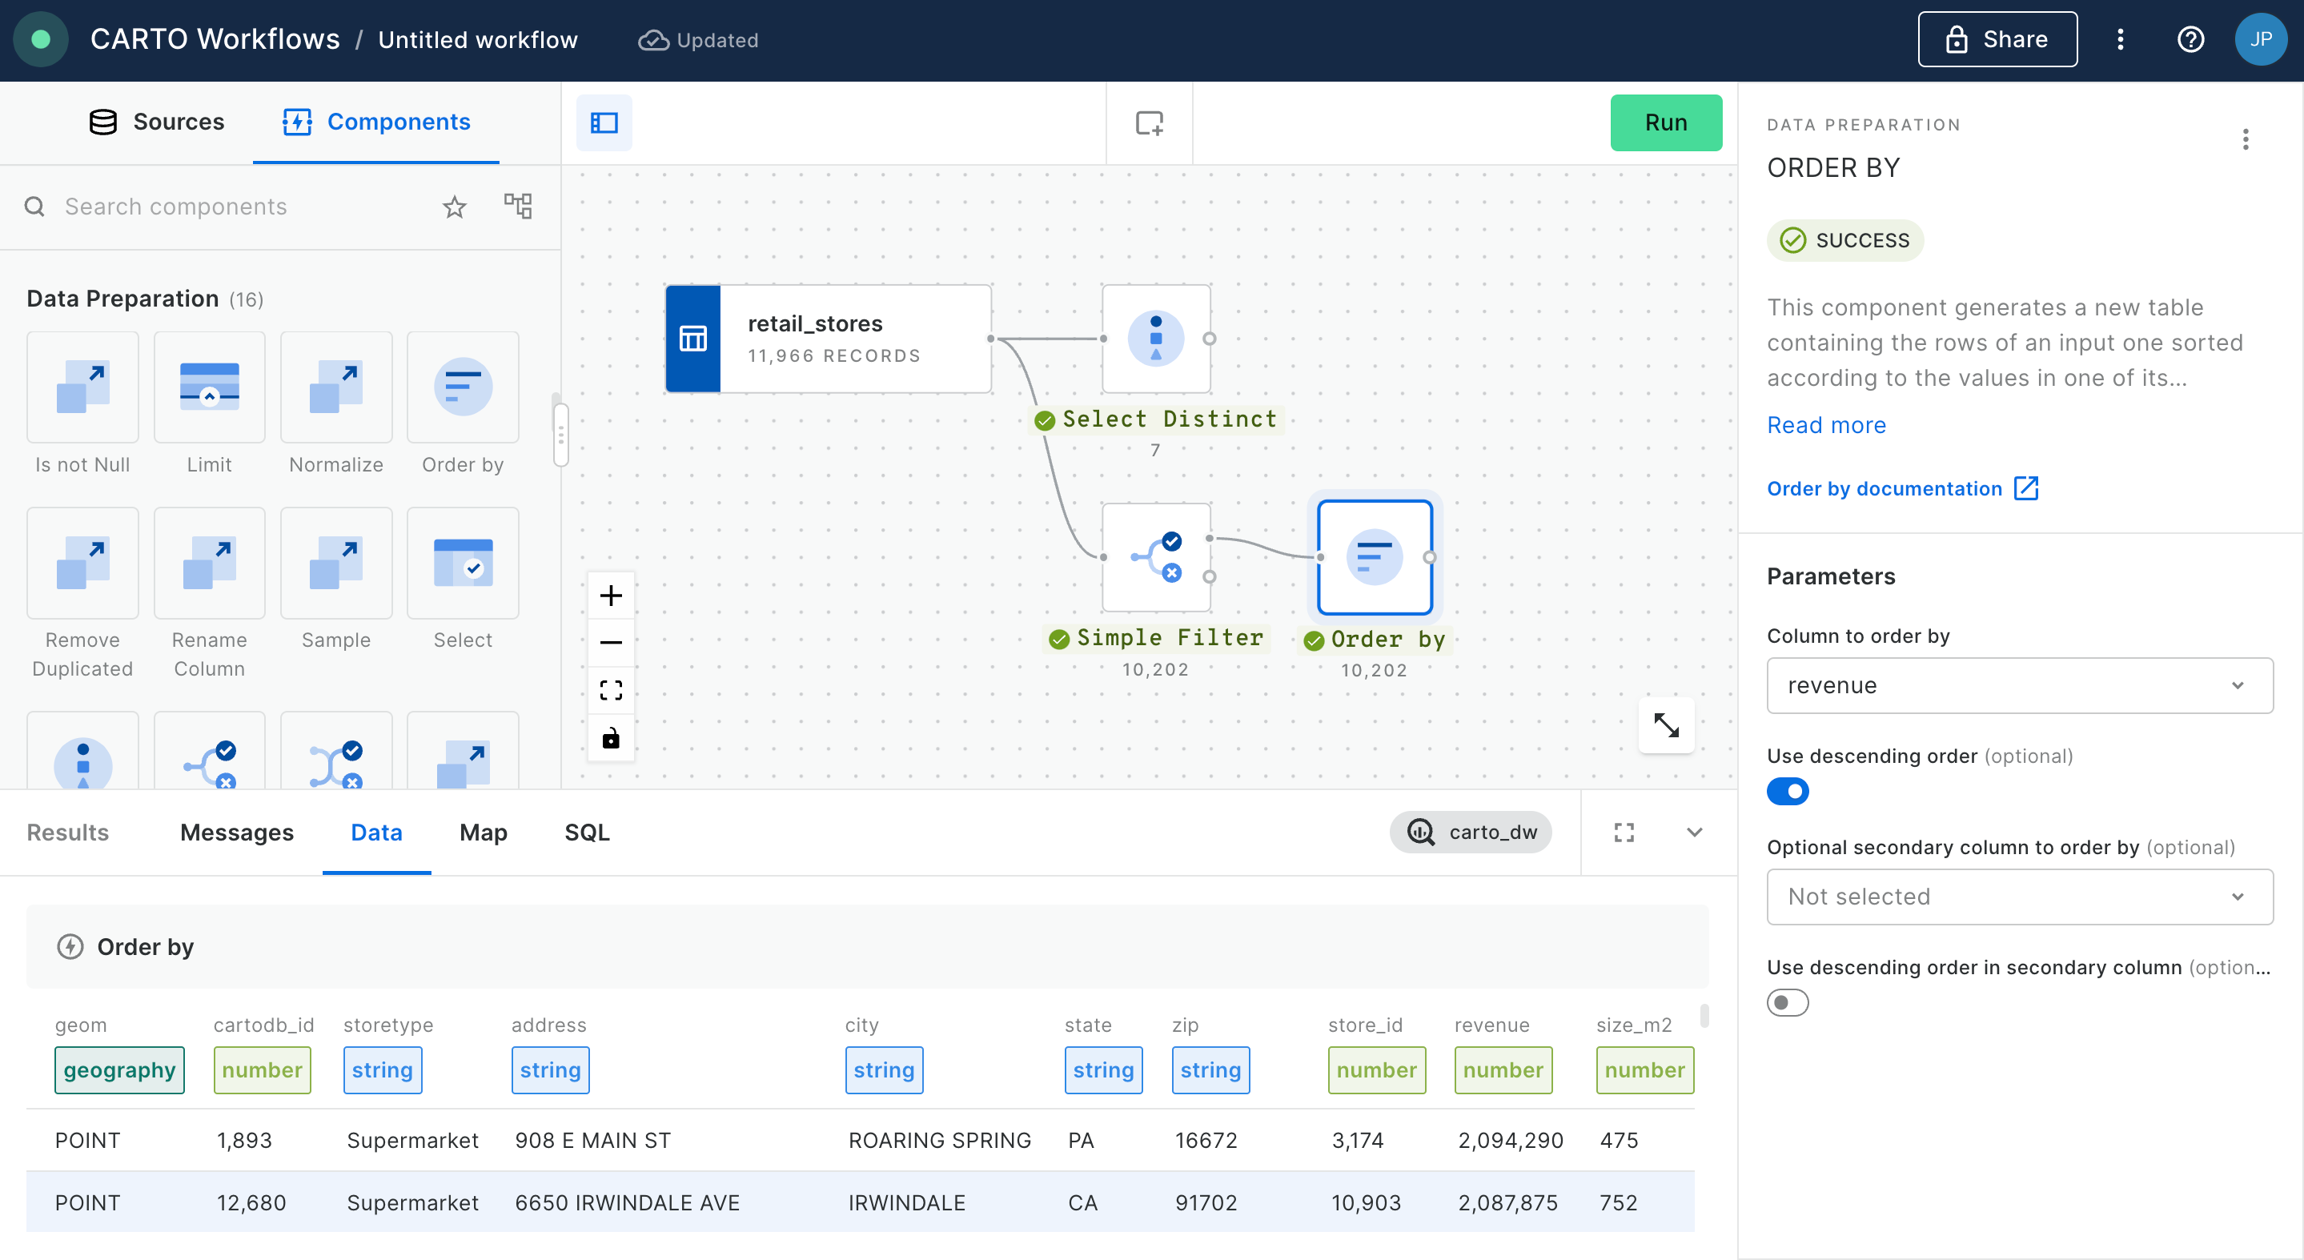
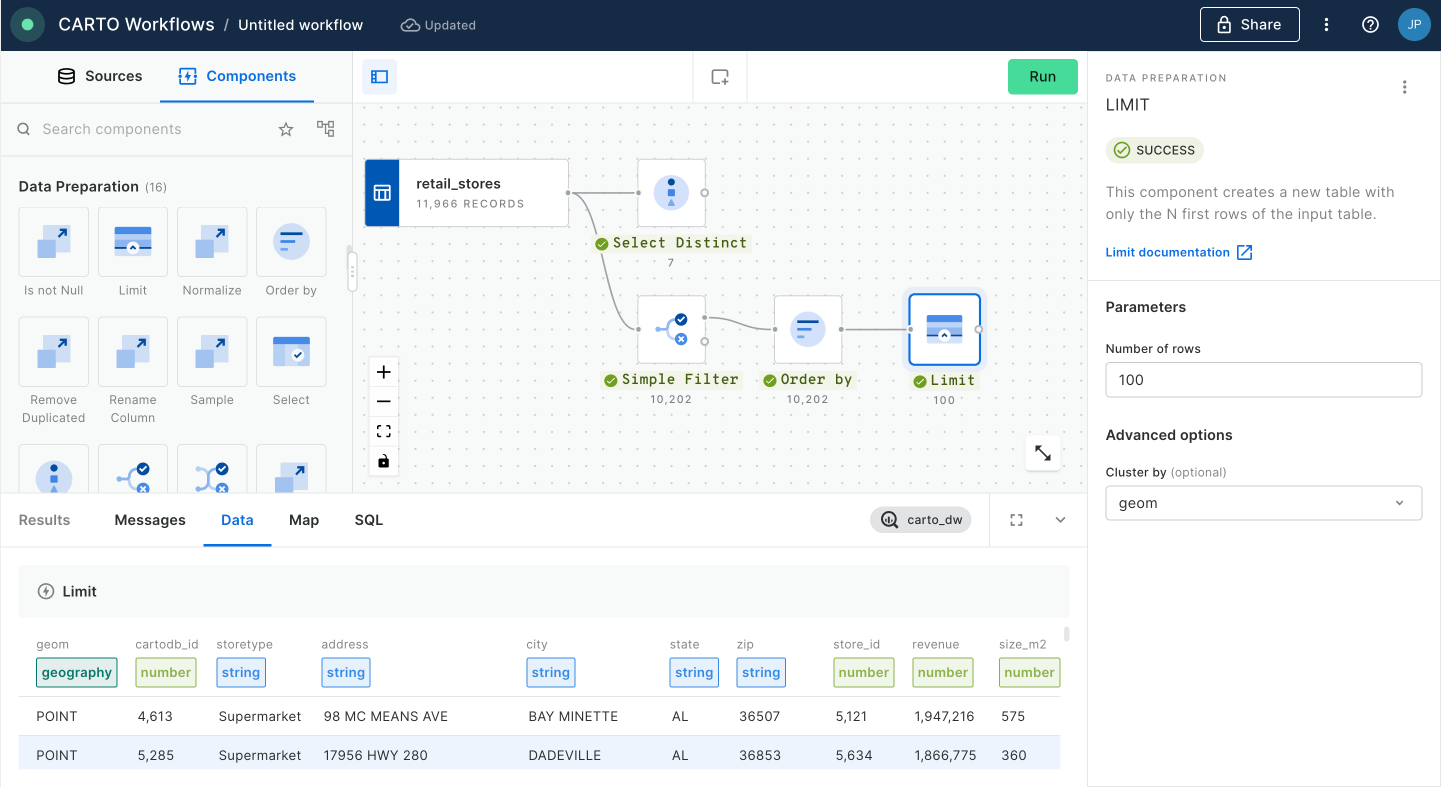
Next add a Limit component - again from Data Preparation - and change the limit to 100, connecting this to the output of Order By.
Click run, to select only the top 100 stores in terms of generated revenue.
Creating walk-time isolines around the stores
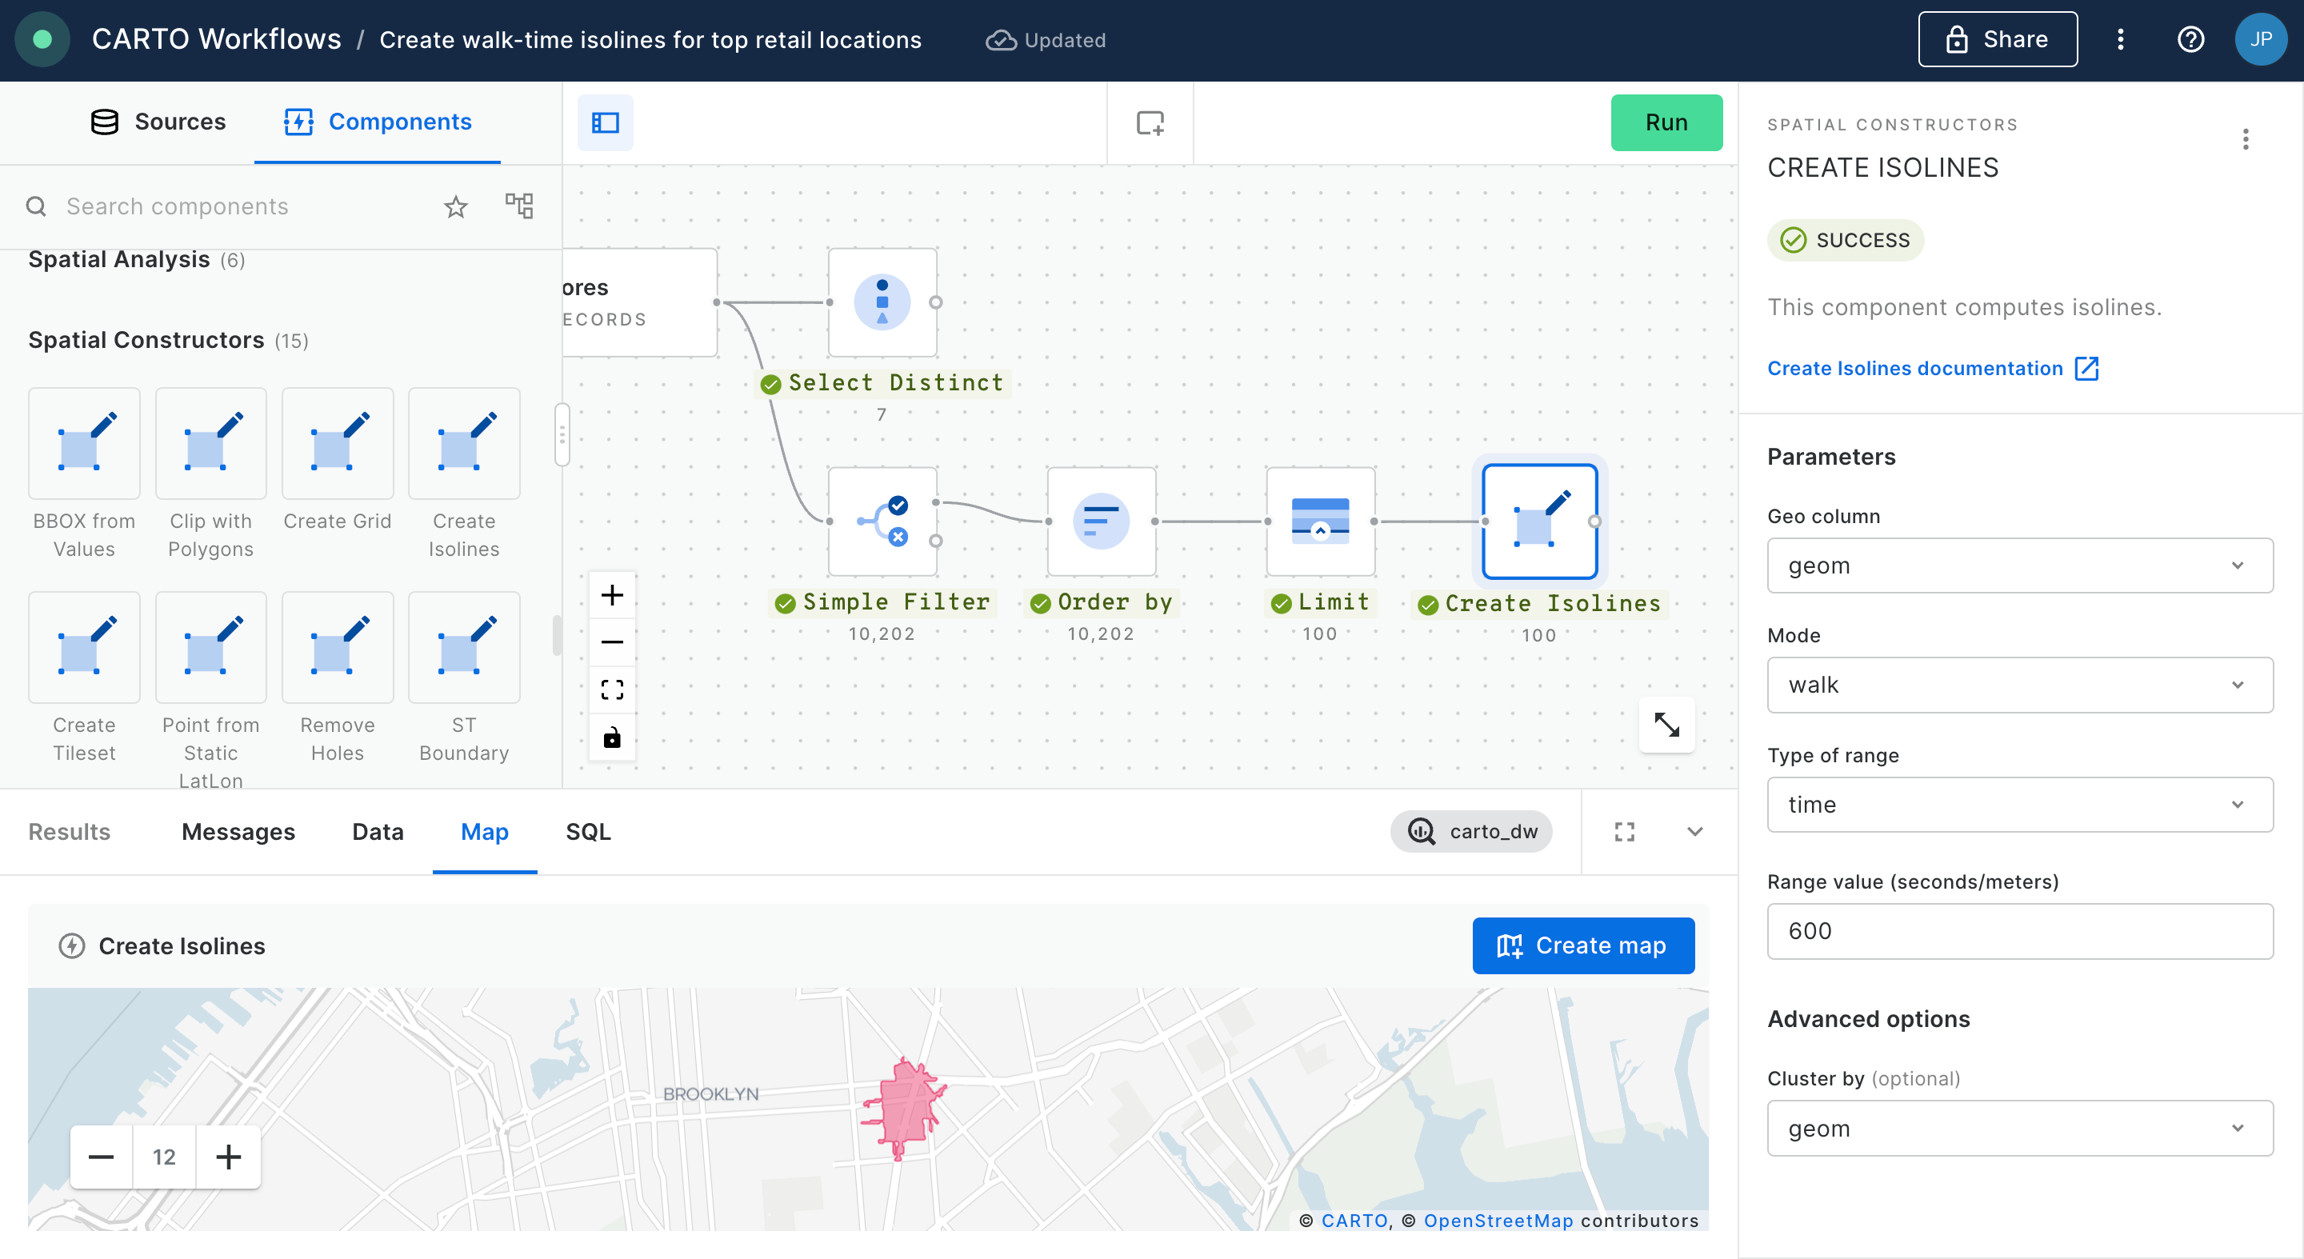
Next, add a Create Isolines component from the Spatial Constructors toolbox. Join the output of Limit to this.
Change the mode to car, the range type to time and range limit to 600 (10 minutes).
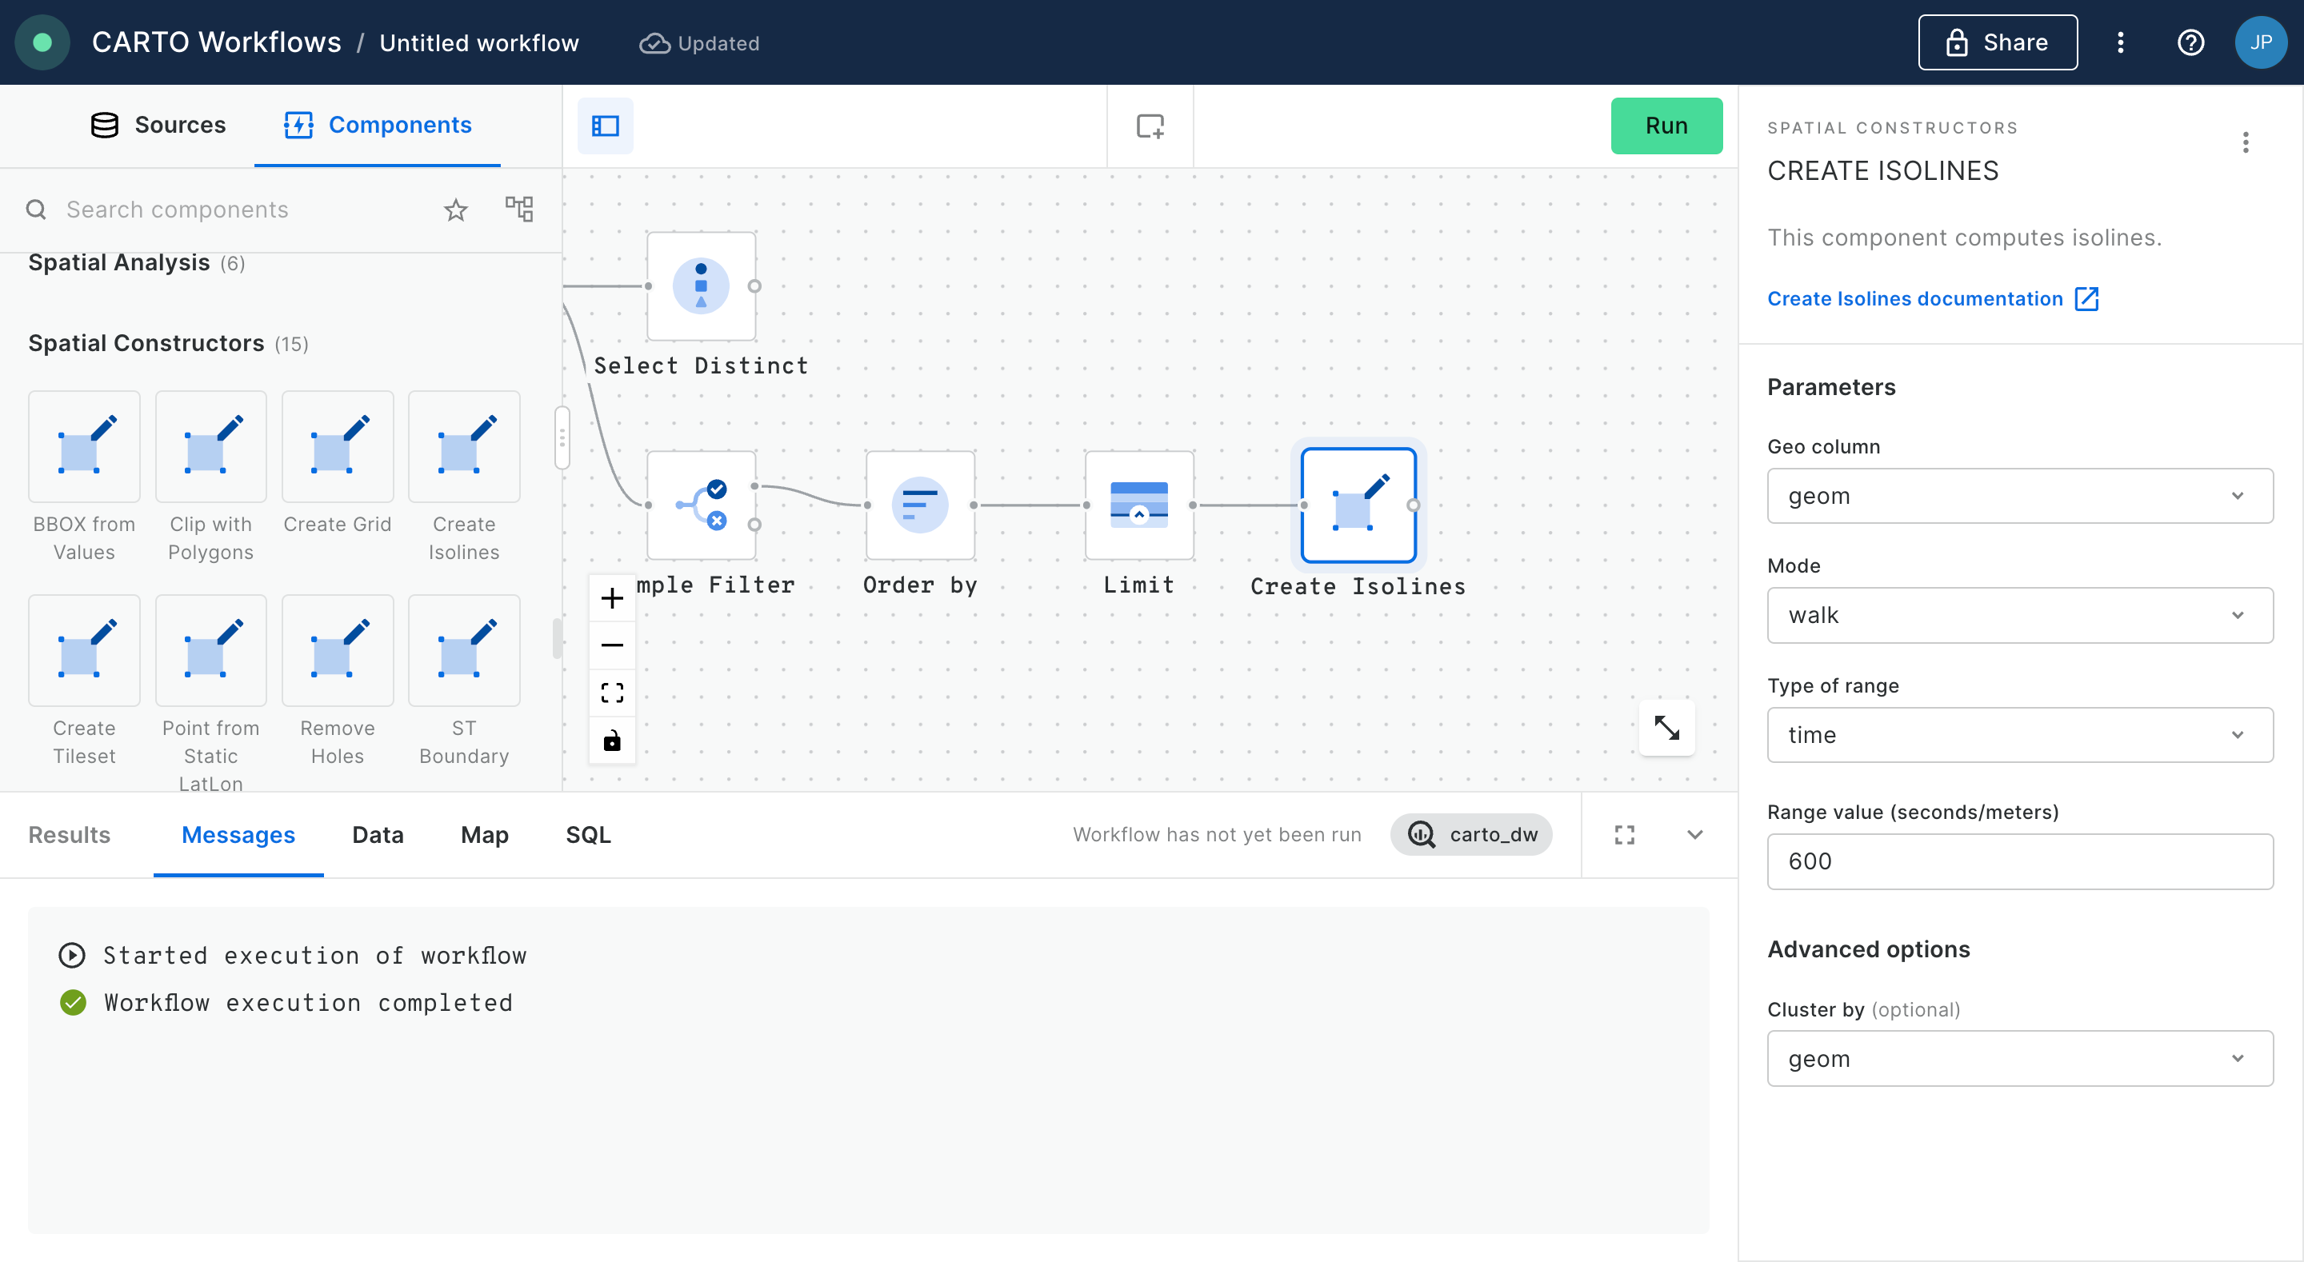
Click run to create 10-minute drive-time isolines. Note this is quite an intensive process compared to many other functions in Workflows (it's calling to an external location data services provider), and so may take a little longer to run.
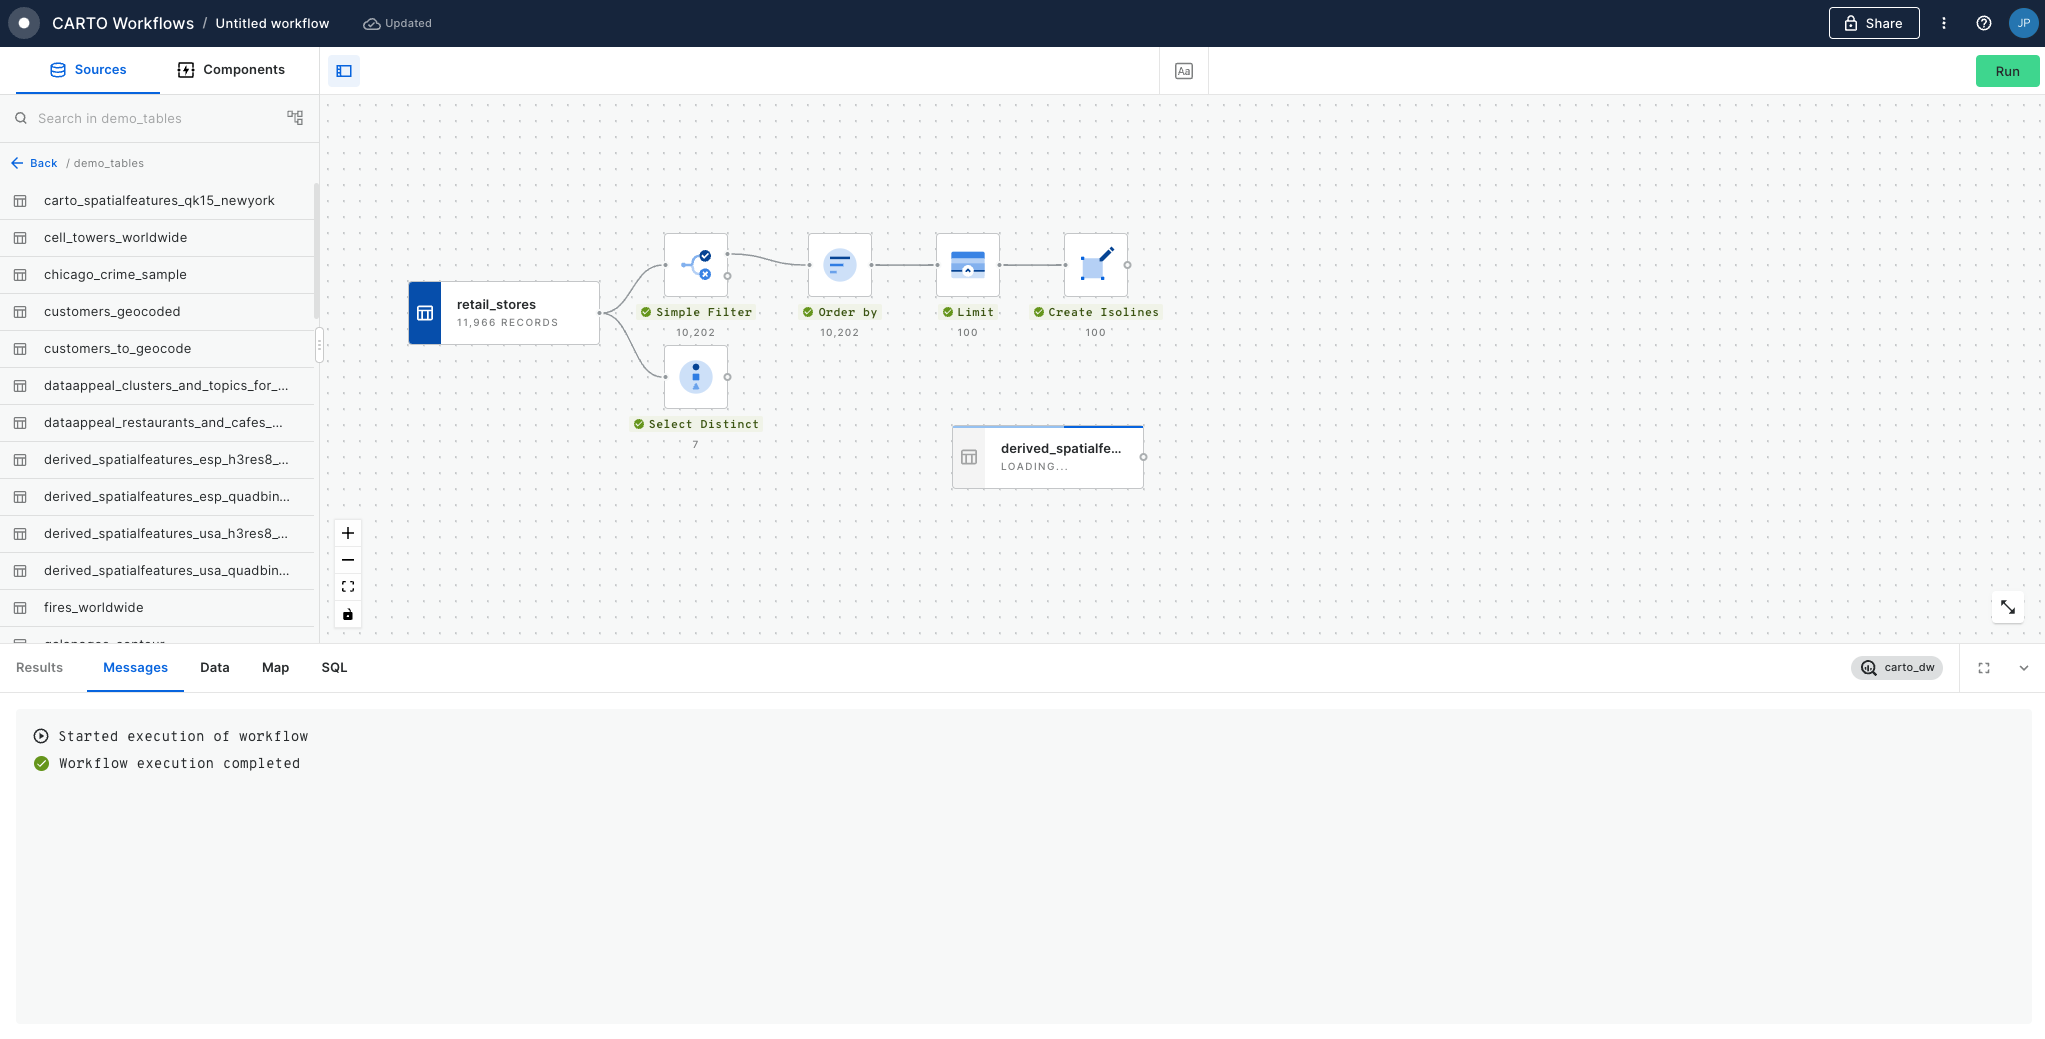
We now add a second input table to the canvas, we will drag and drop the table
derived_spatialfeatures_usa_h3res8_v1_yearly_v2fromdemo_tables. This table include different spatial features (e.g. population, POIs, climatology, urbanity level, etc.) aggregated at H3 grid with resolution 8.
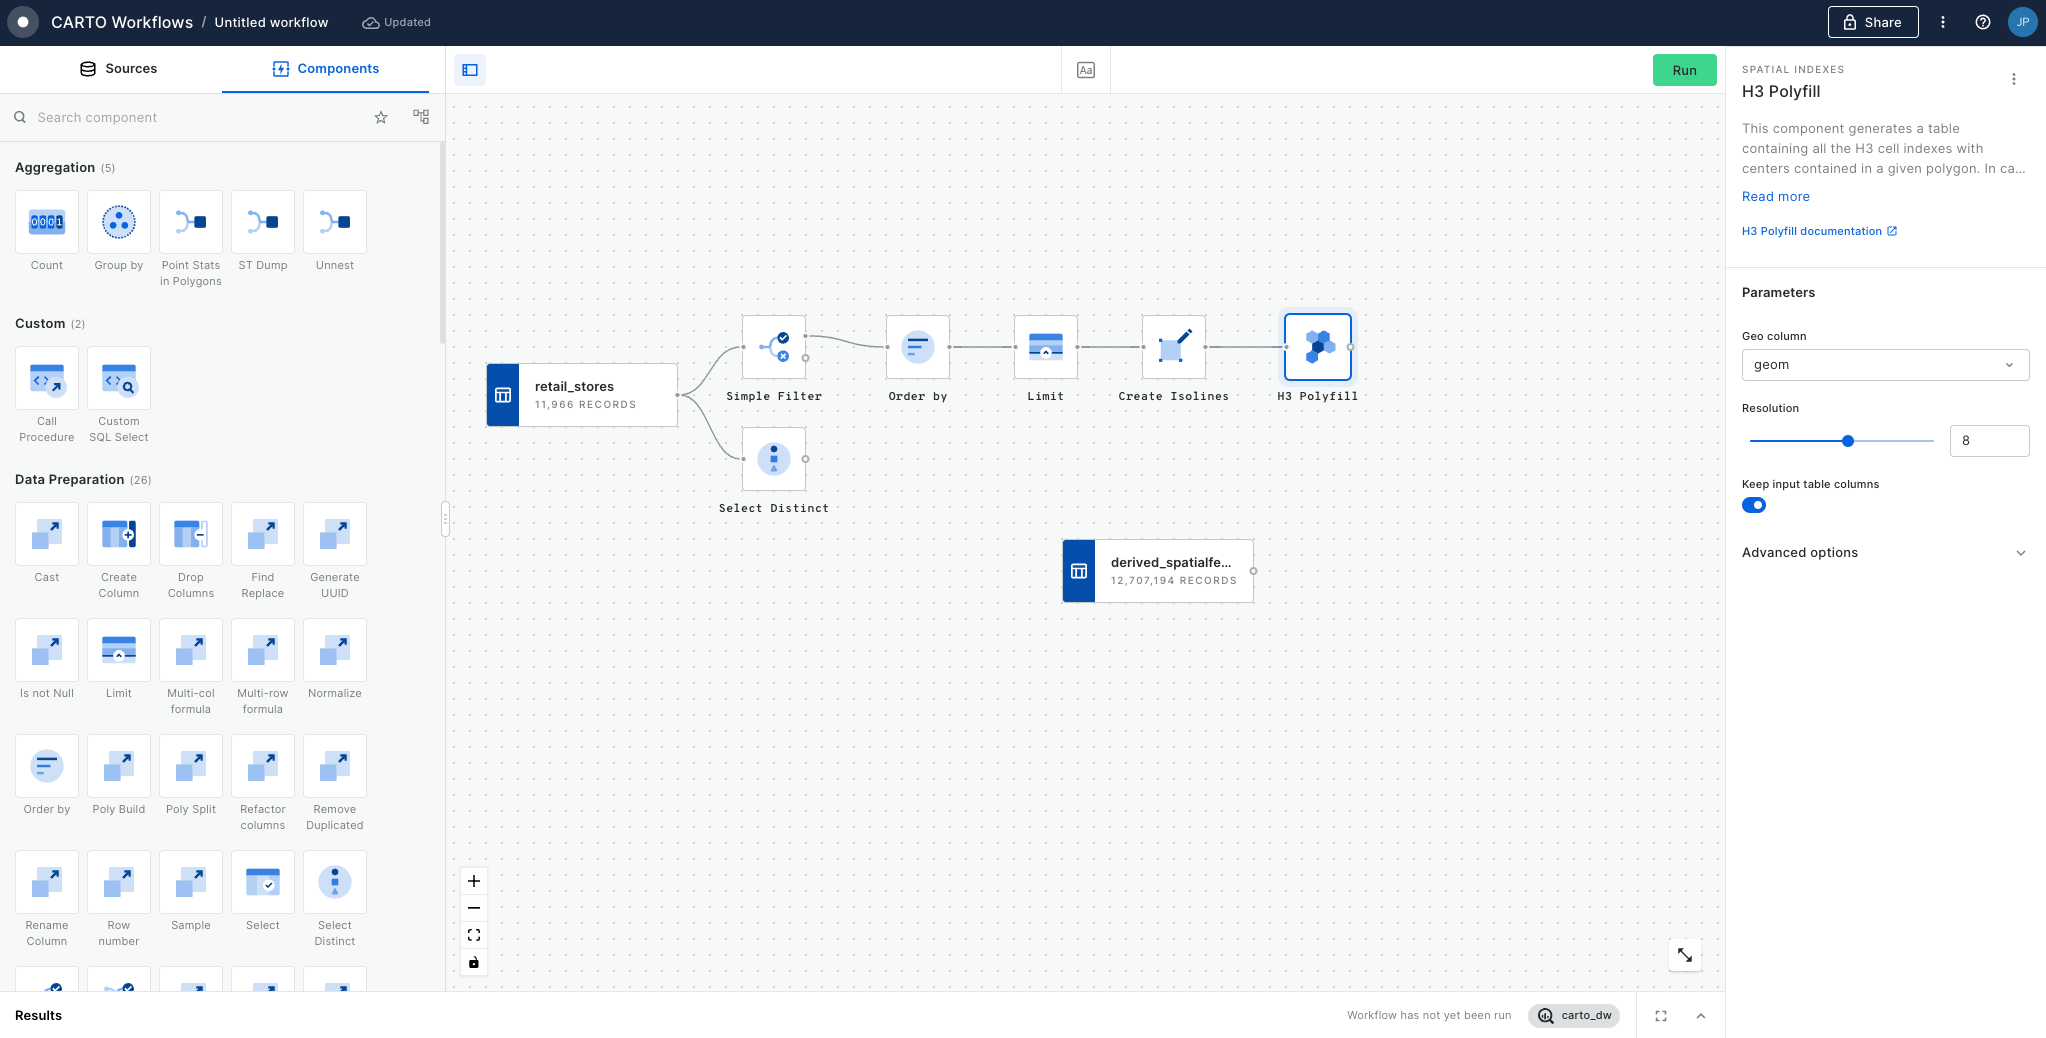
In order to be able to join the population data with the areas around each retail store, we will use the component H3 Polyfill in order to compute the H3 grid cells in resolution 8 that cover each of the isolines around the stores. We configure the node by selecting the Geo column "geom", configuring the Resolution value to 8 and enabling the option to keep input table columns.
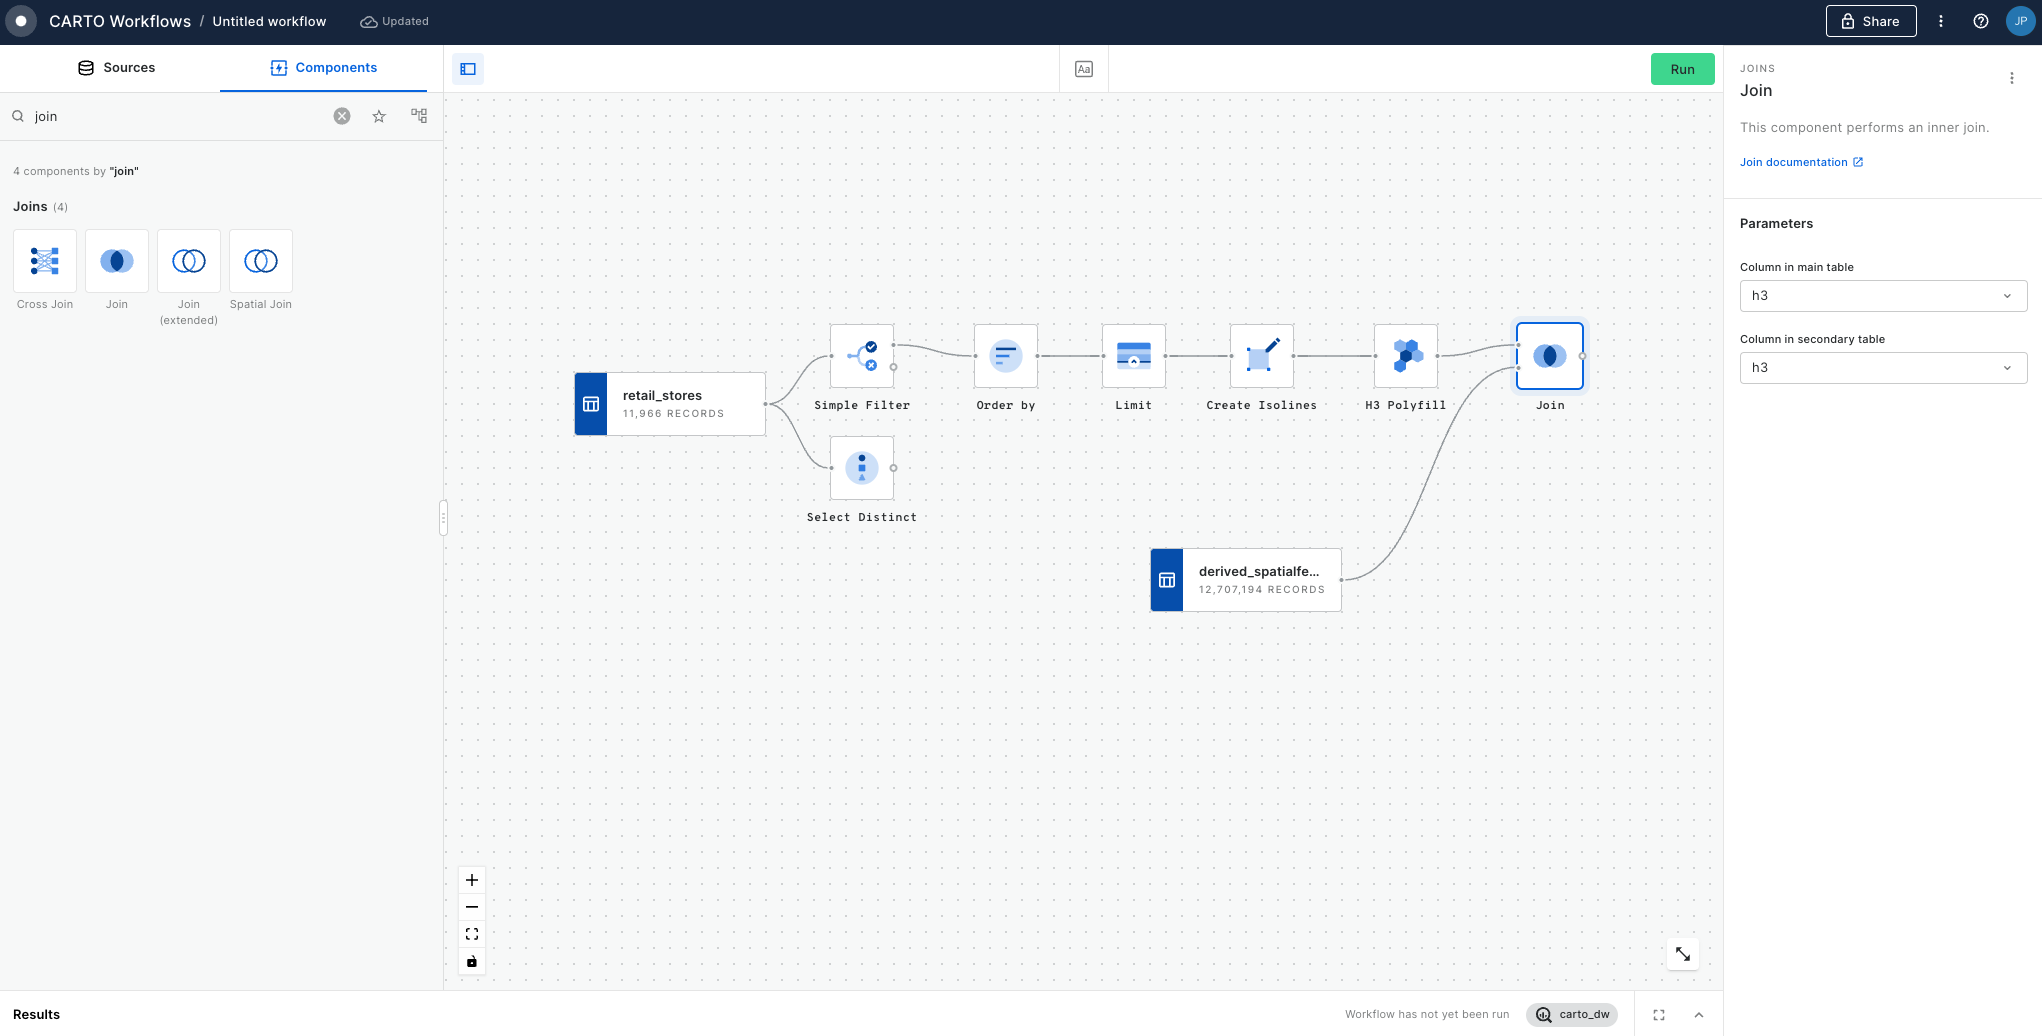
Next step is to join both tables based on their H3 indices. For that, we will use the Join component. We select the columns named h3 present in both tables to perform an inner join operation.
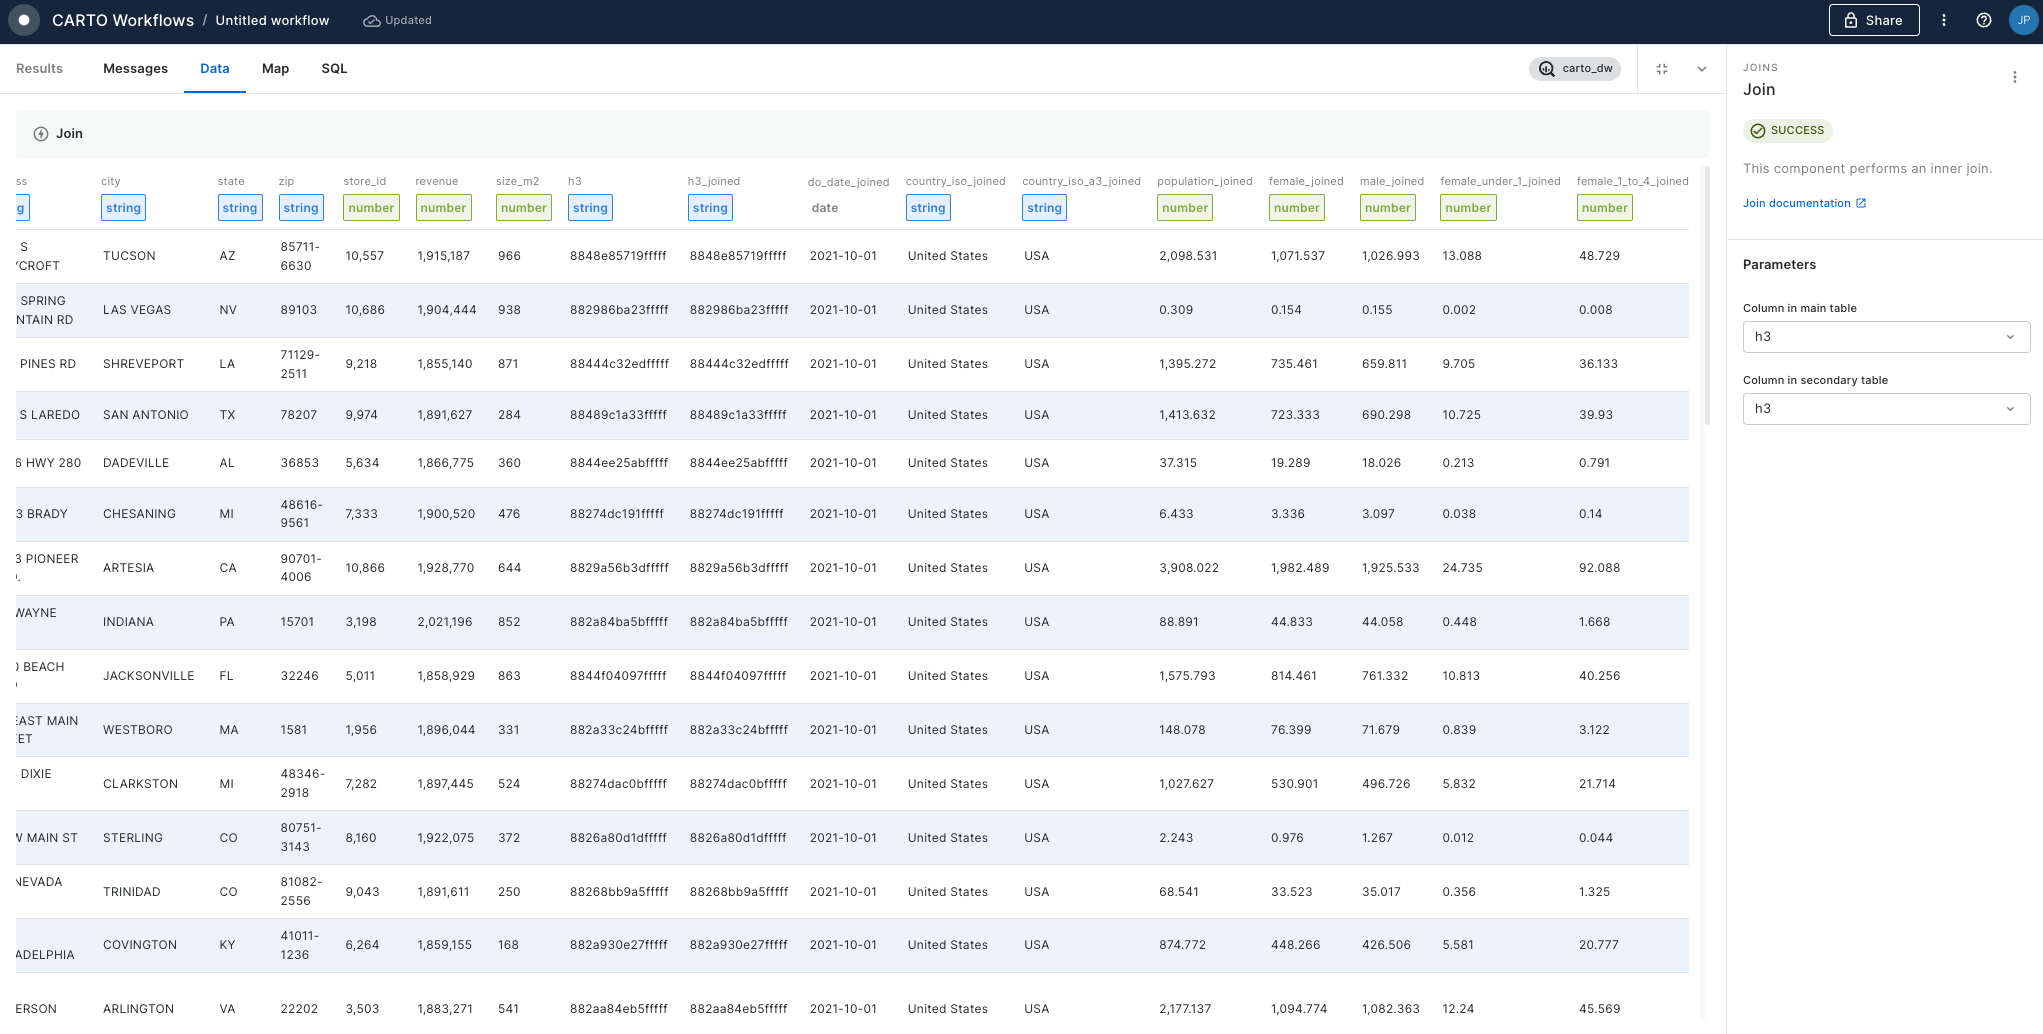
Check in the results tab that now you have joined data coming from the retail_stores table with data from CARTO's spatial features dataset.
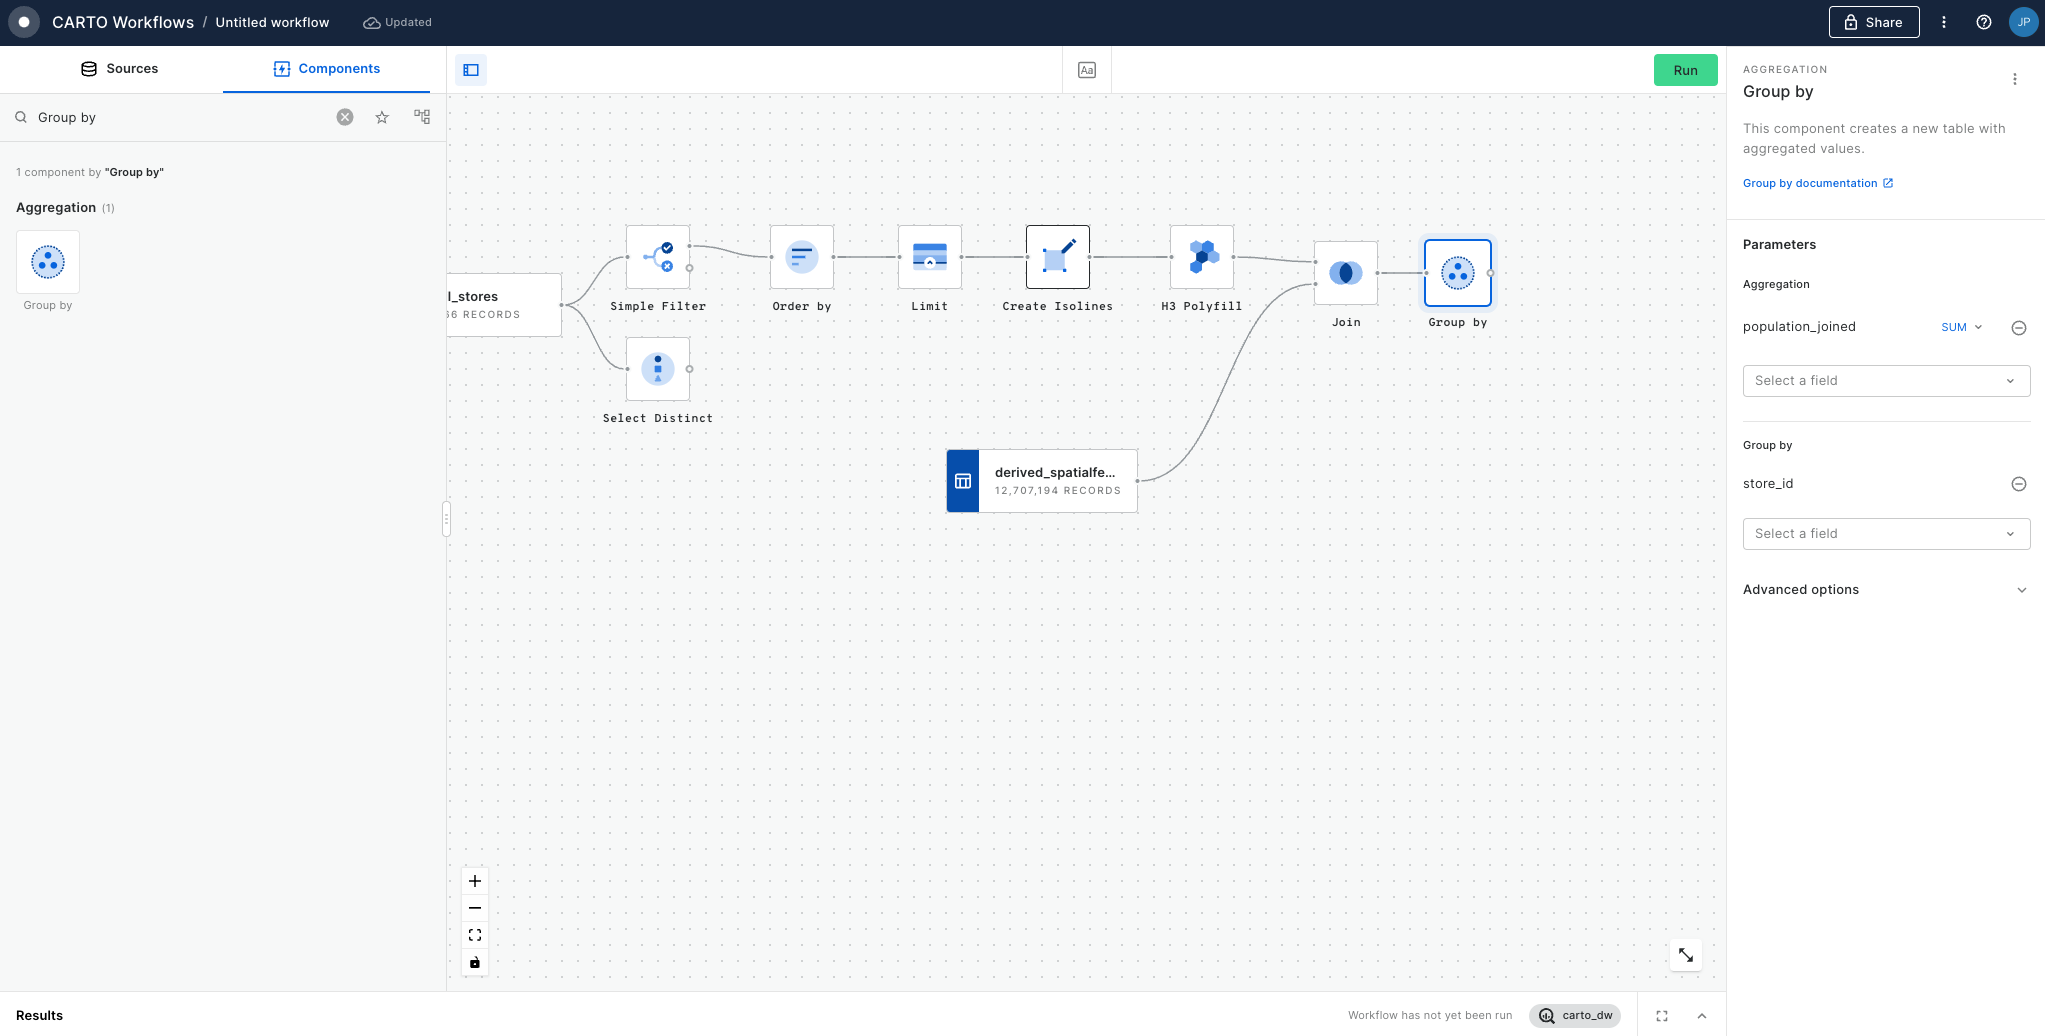
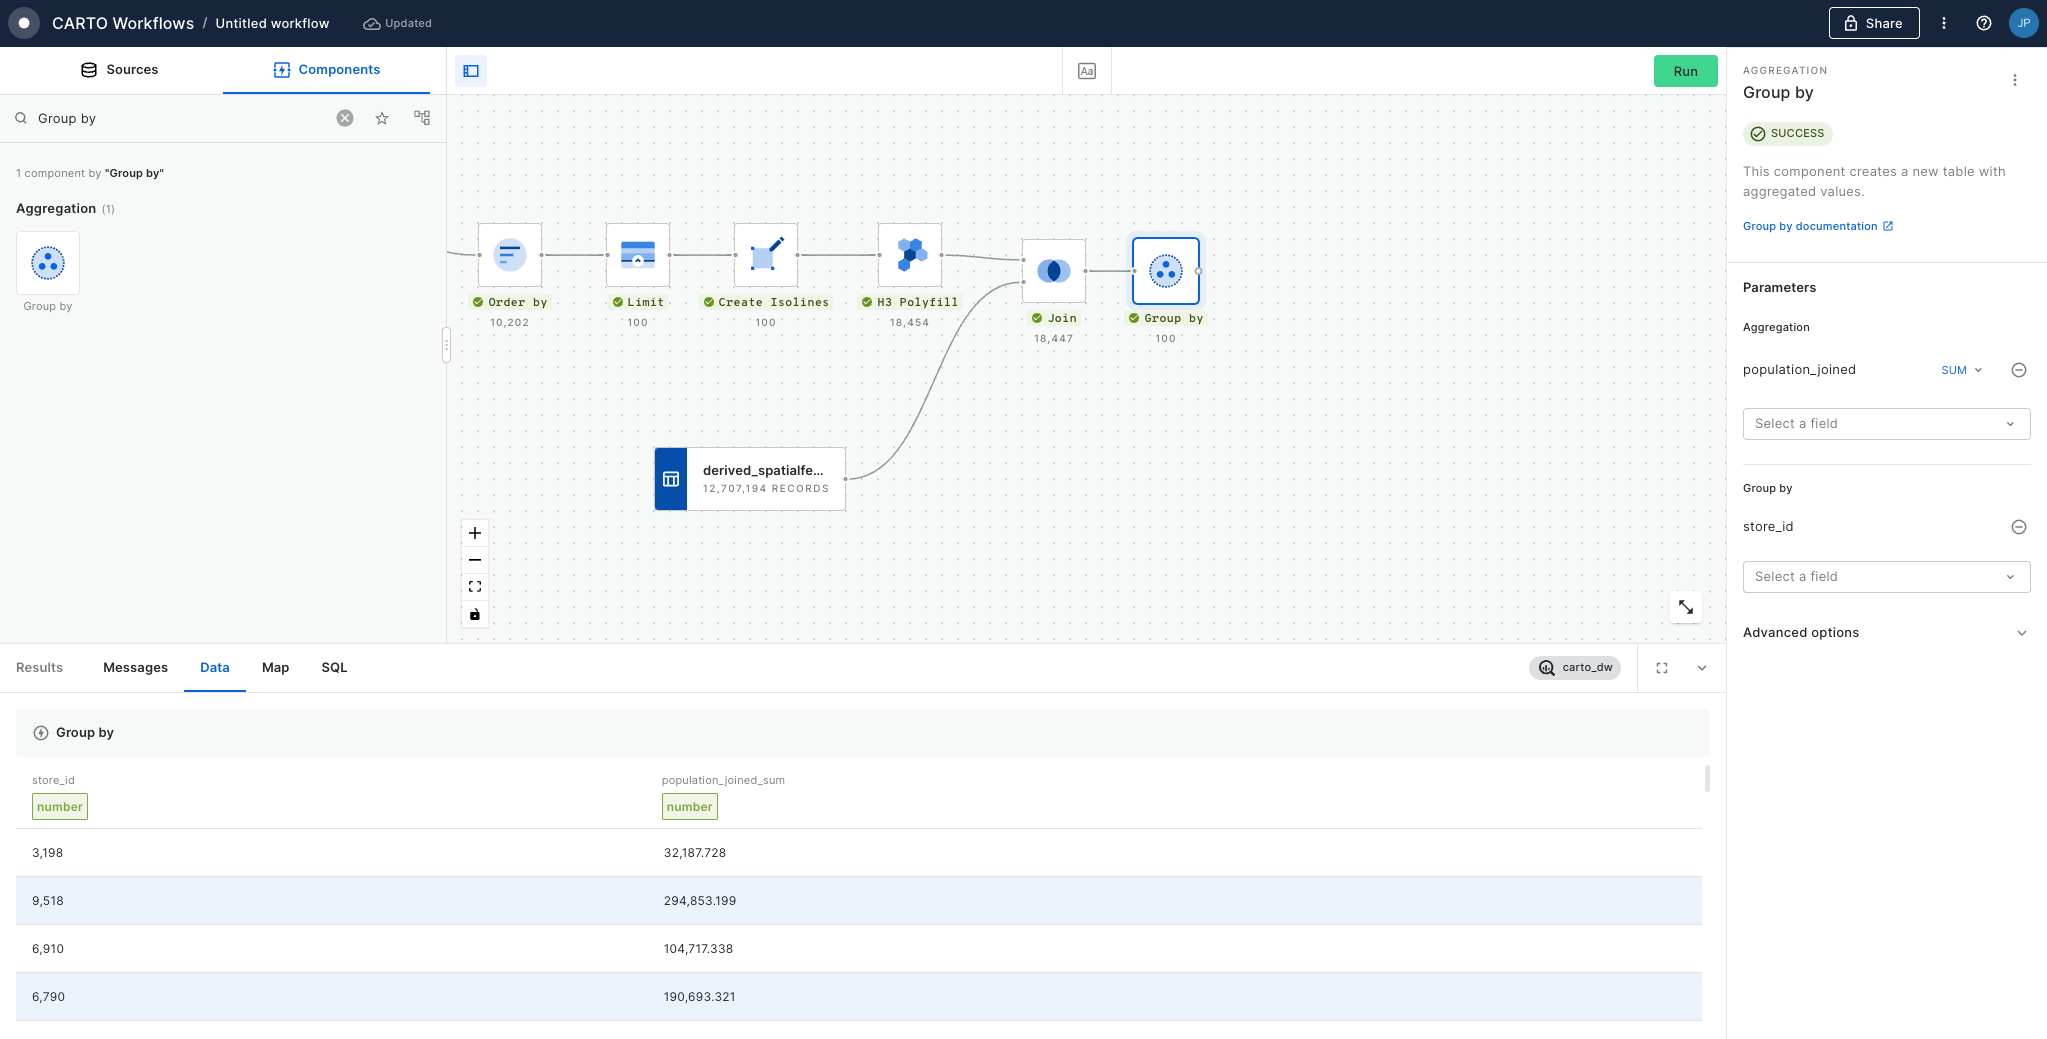
As we now have multiple H3 grid cells for each retail store, what we want to do is to aggregate the population associated with the area around each store (the H3 polyfilled isoline). In order to do that we are going to use the Group By component, and we are going to aggregate the
population_joinedcolumn with a SUM as the aggregation operation and we are going to group by the table by thestore_idcolumn.
Now, check that in the results what we have again is one row per retail store (i.e. 100 rows) and in each of them we have the store_id and the result of the sum of the population_joined values for the different H3 cells that were associated with the isoline around each store.
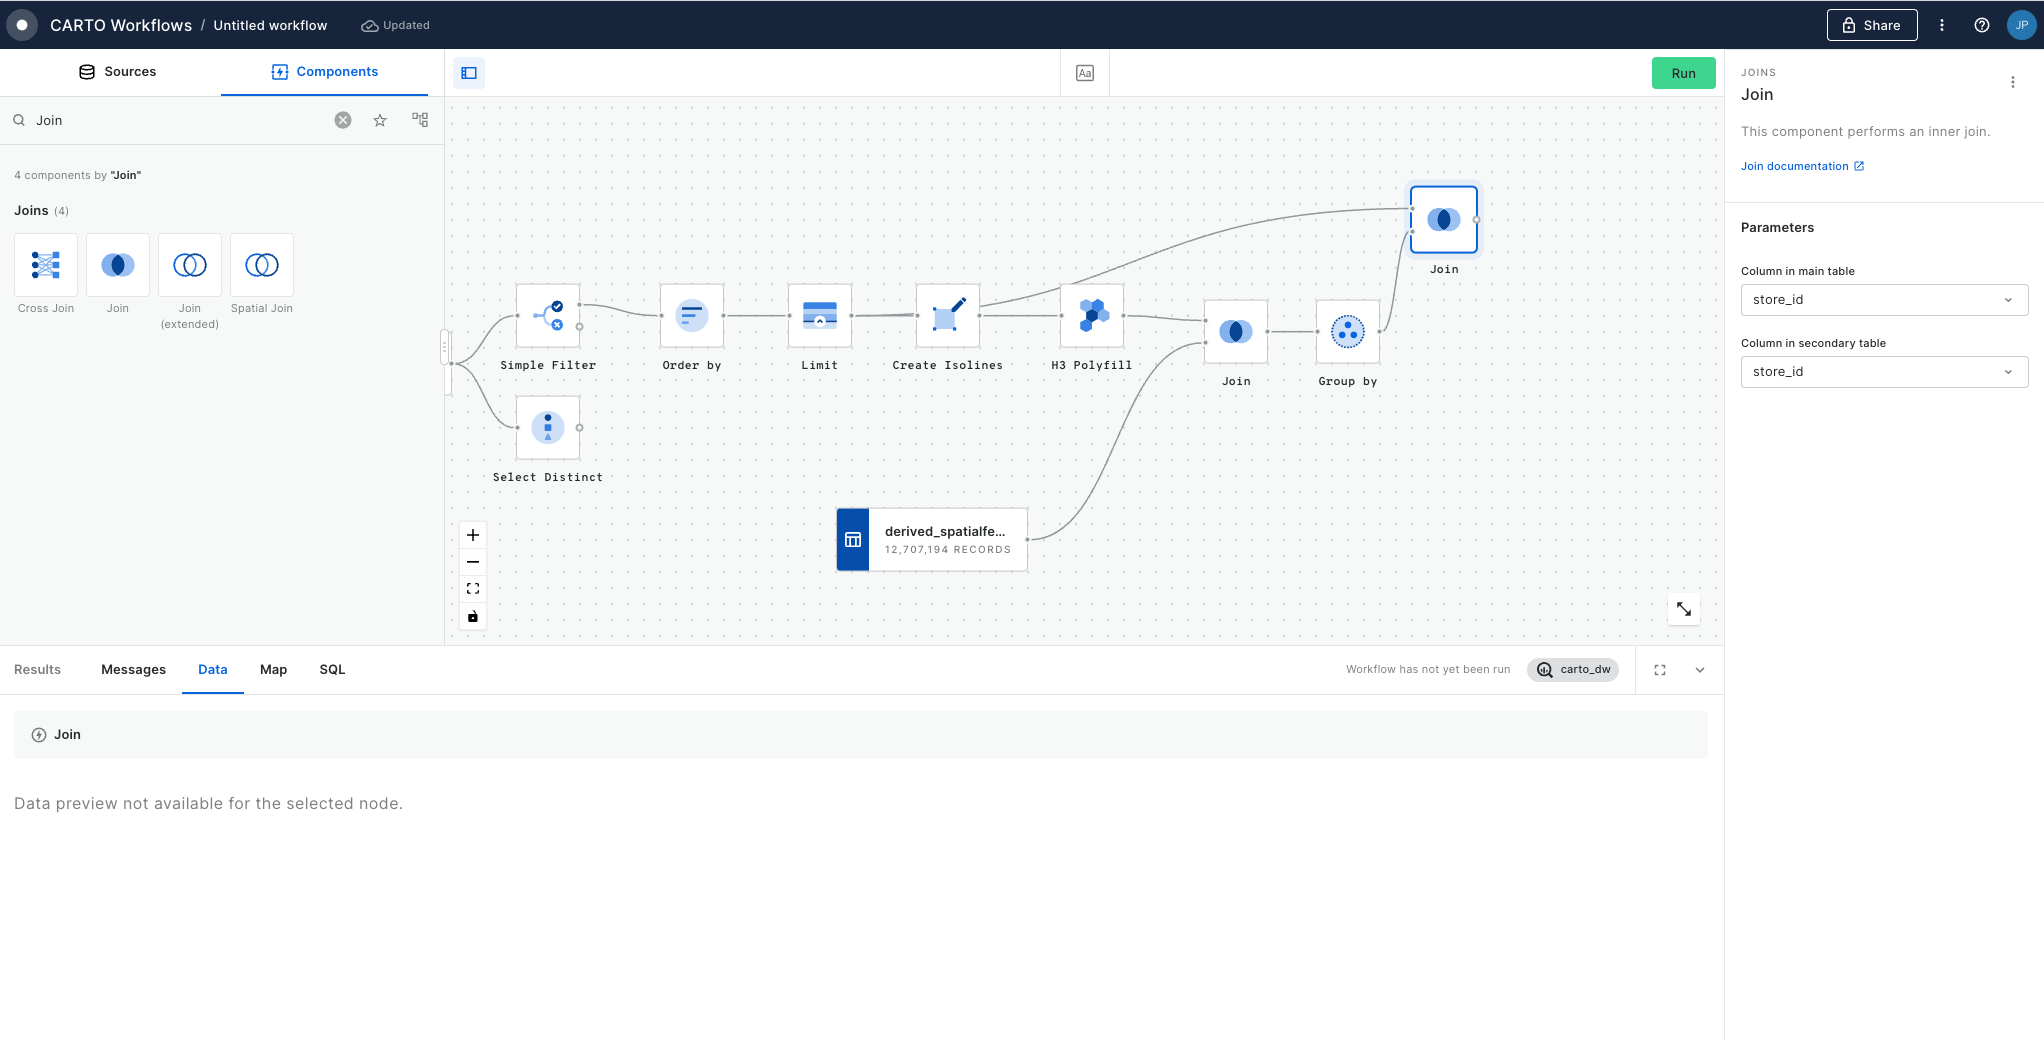
We are going to re-join with a Join component the data about the retail_stores (including the point geometry) with the aggregated population we have now. We take the output of the previous Limit component and we add it to a new Join component together with the data we generated in the previous step to perform an inner join. We will use the column
store_idto join both tables.
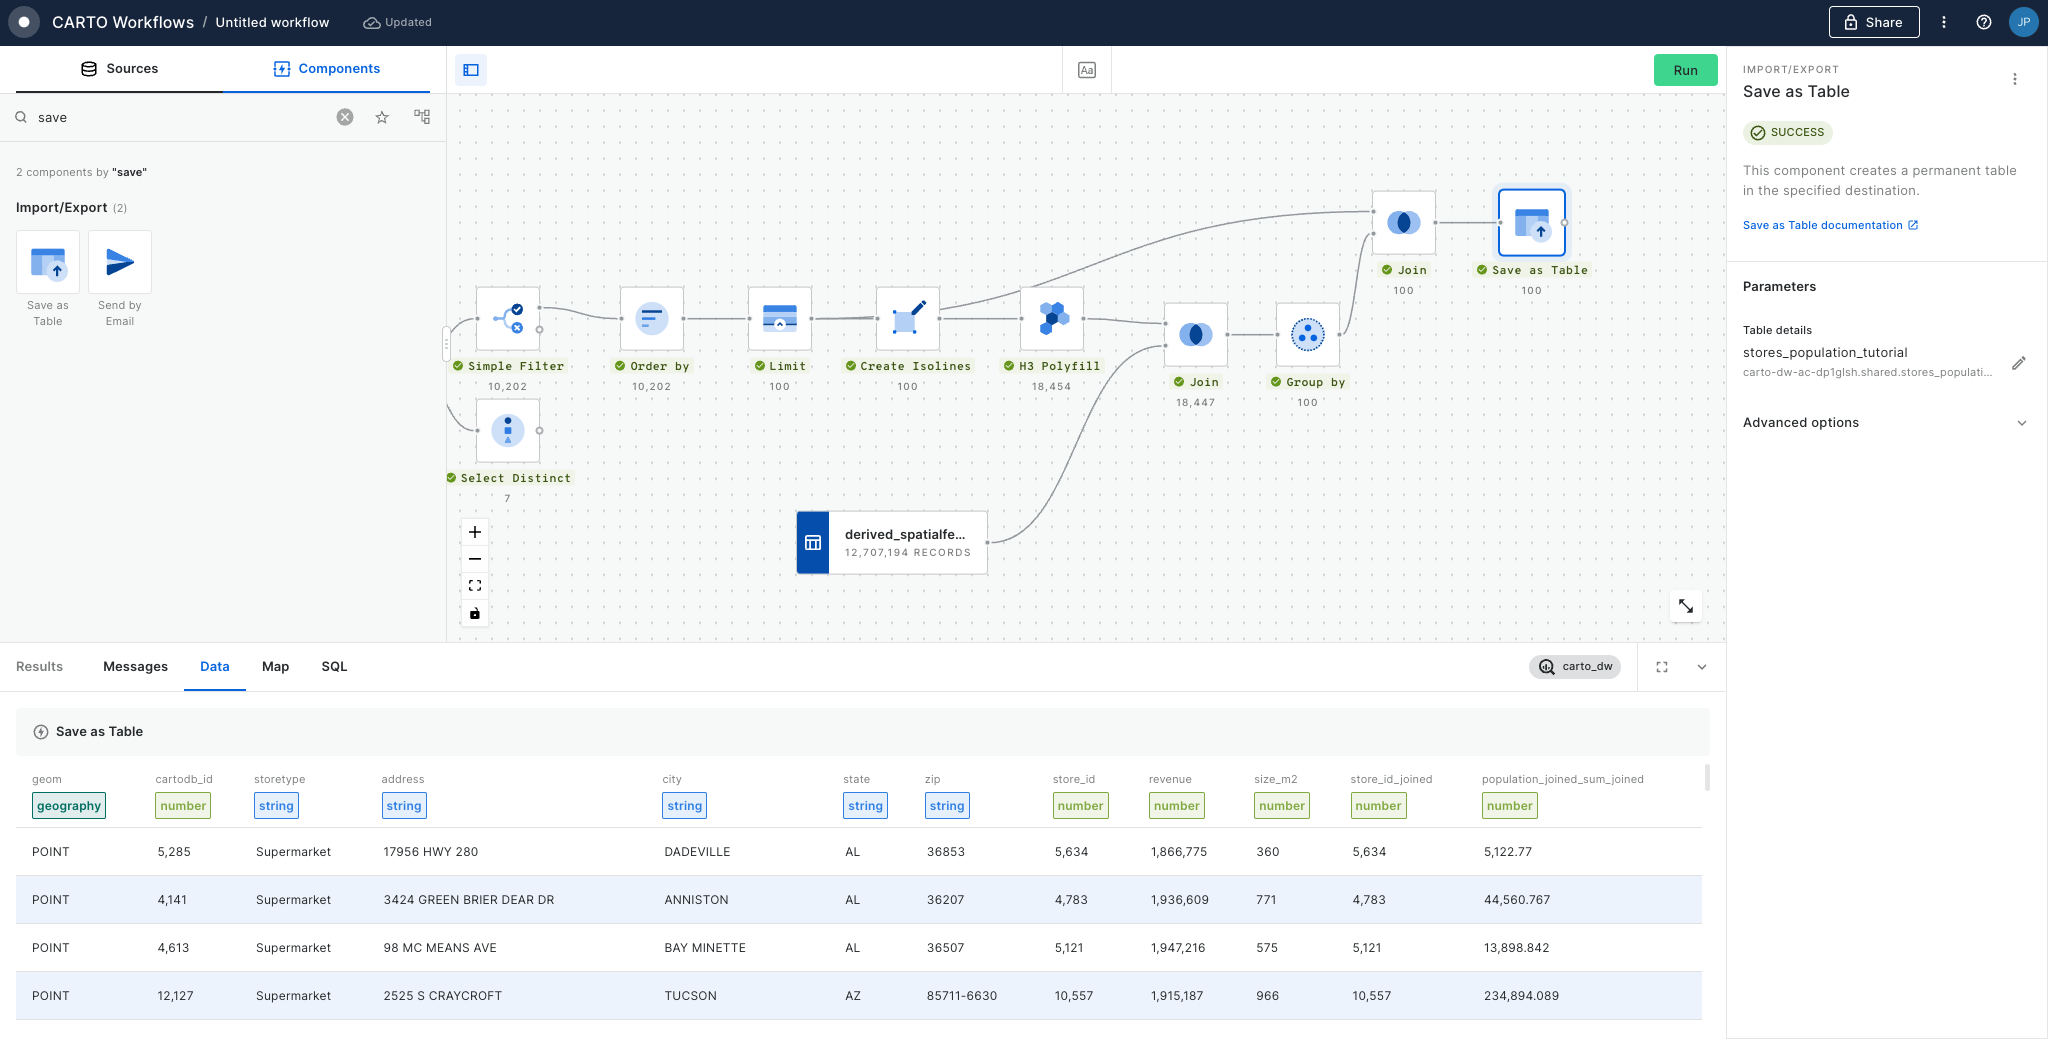
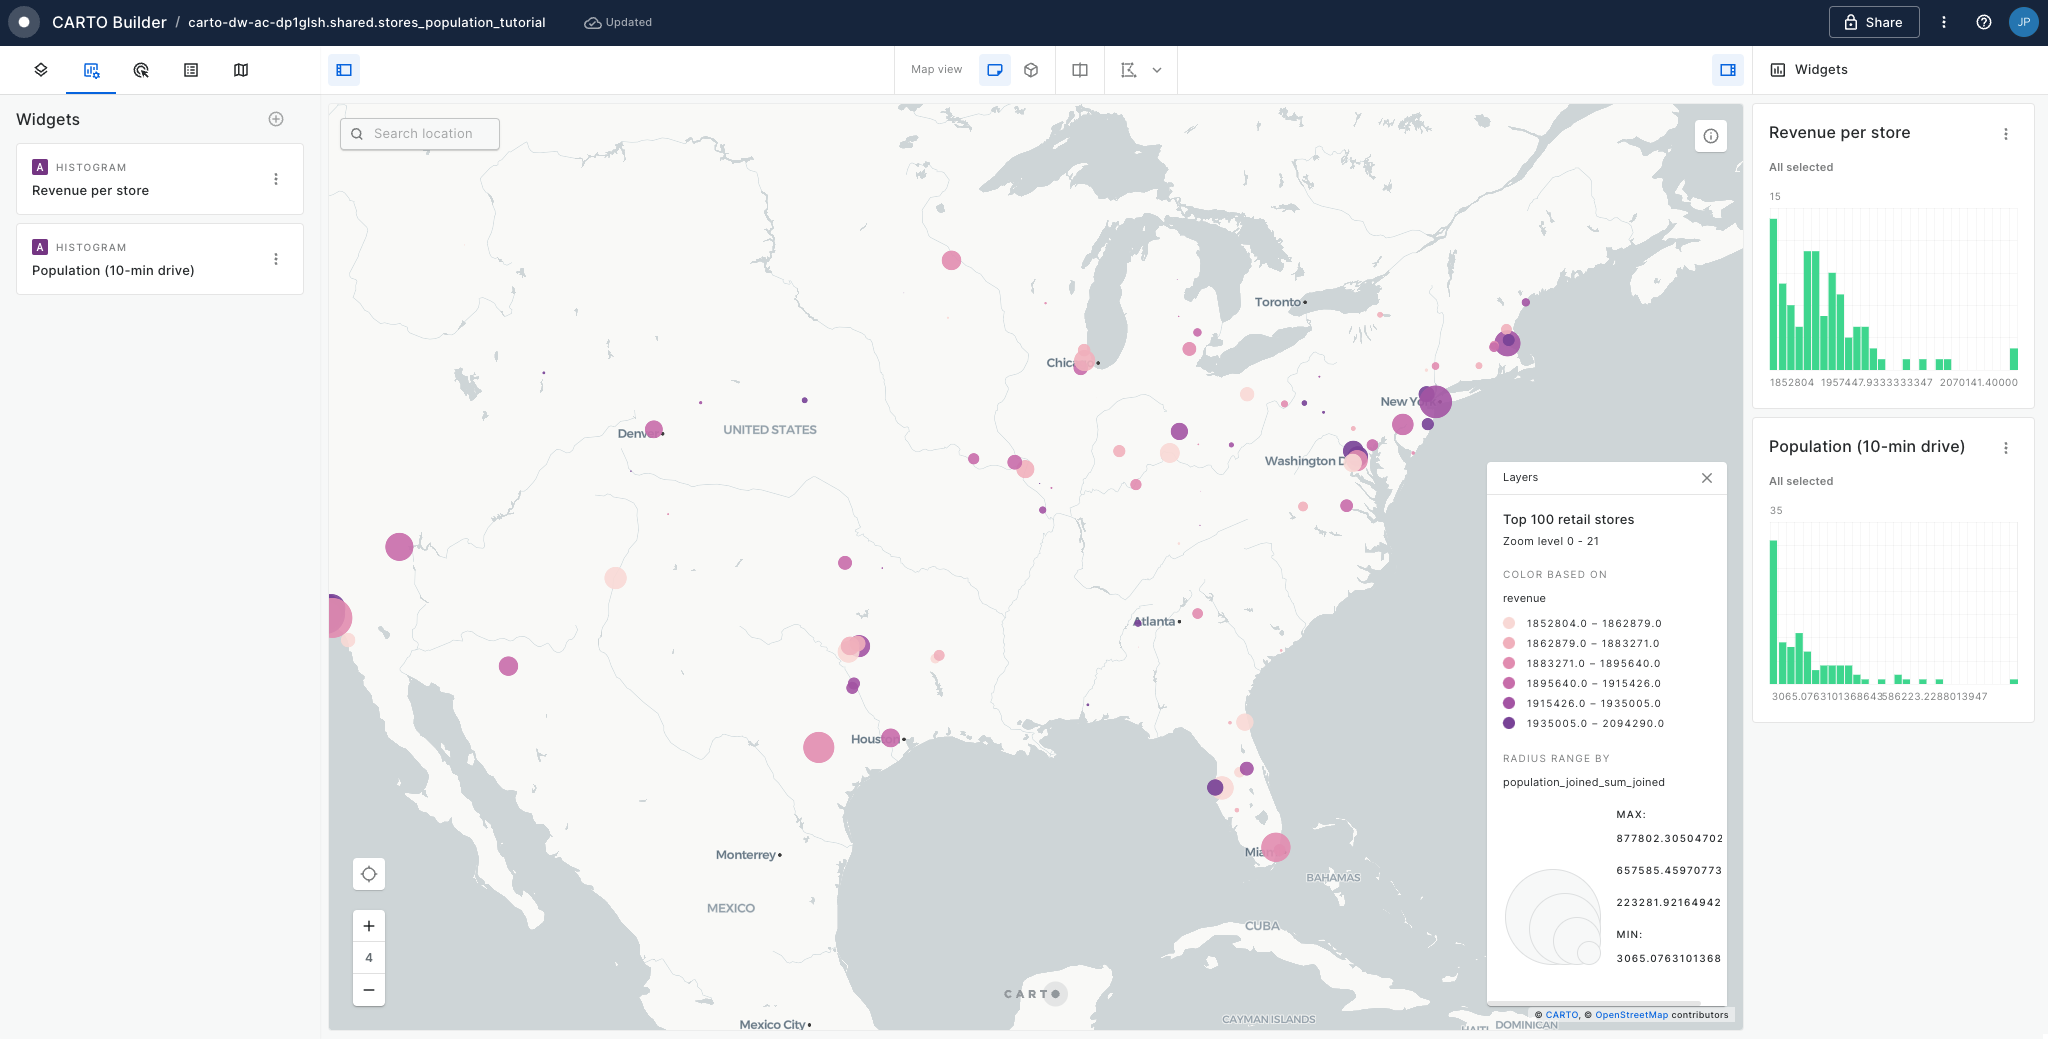
Finally we use the Save as table component to save the results as a new table in our data warehouse. We can then use the "Create map" option to build an interactive map to explore this data further.
Last updated
Was this helpful?

