Step-by-step tutorials
In this section we provide a set of examples that showcase how to leverage the functions of our Analytics Toolbox for Snowflake to unlock advanced spatial analyses in your data warehouse platform. They cover a broad range of use cases with methods for data transformations, enrichment, spatial indexing in Quadbin and H3, statistics, clustering, spatial data science methods and more.
In order to get access to the data needed to replicate these tutorials in your Snowflake account, please subscribe to our public listing in Snowflake's Data Marketplace:

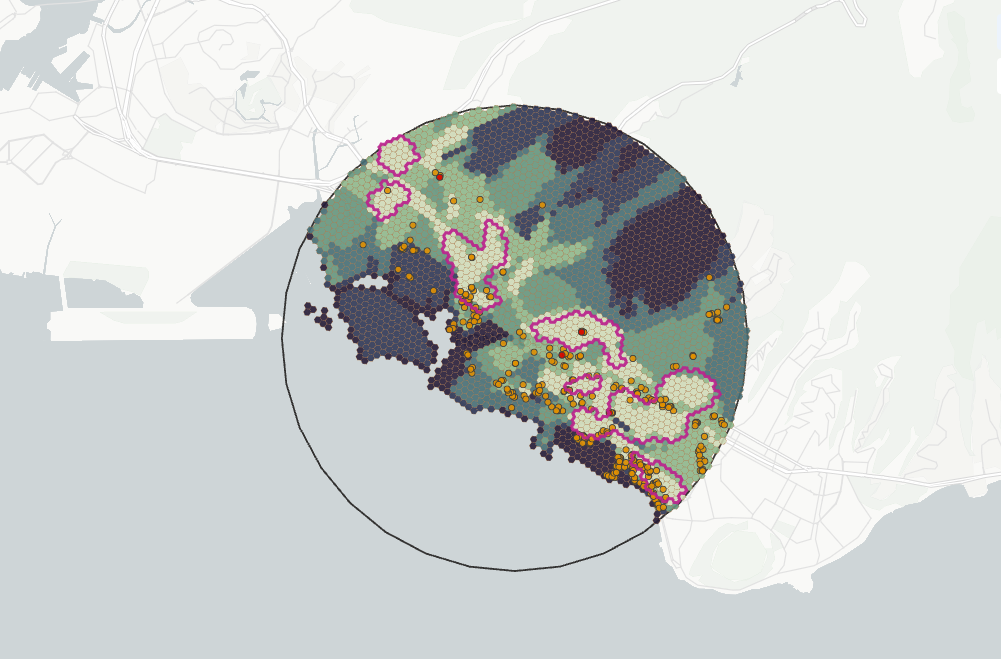
In this tutorial we show how to combine (spatial) variables into a meaningful composite indicator using CARTO Analytics Toolbox for Snowflake.
STATISTICS
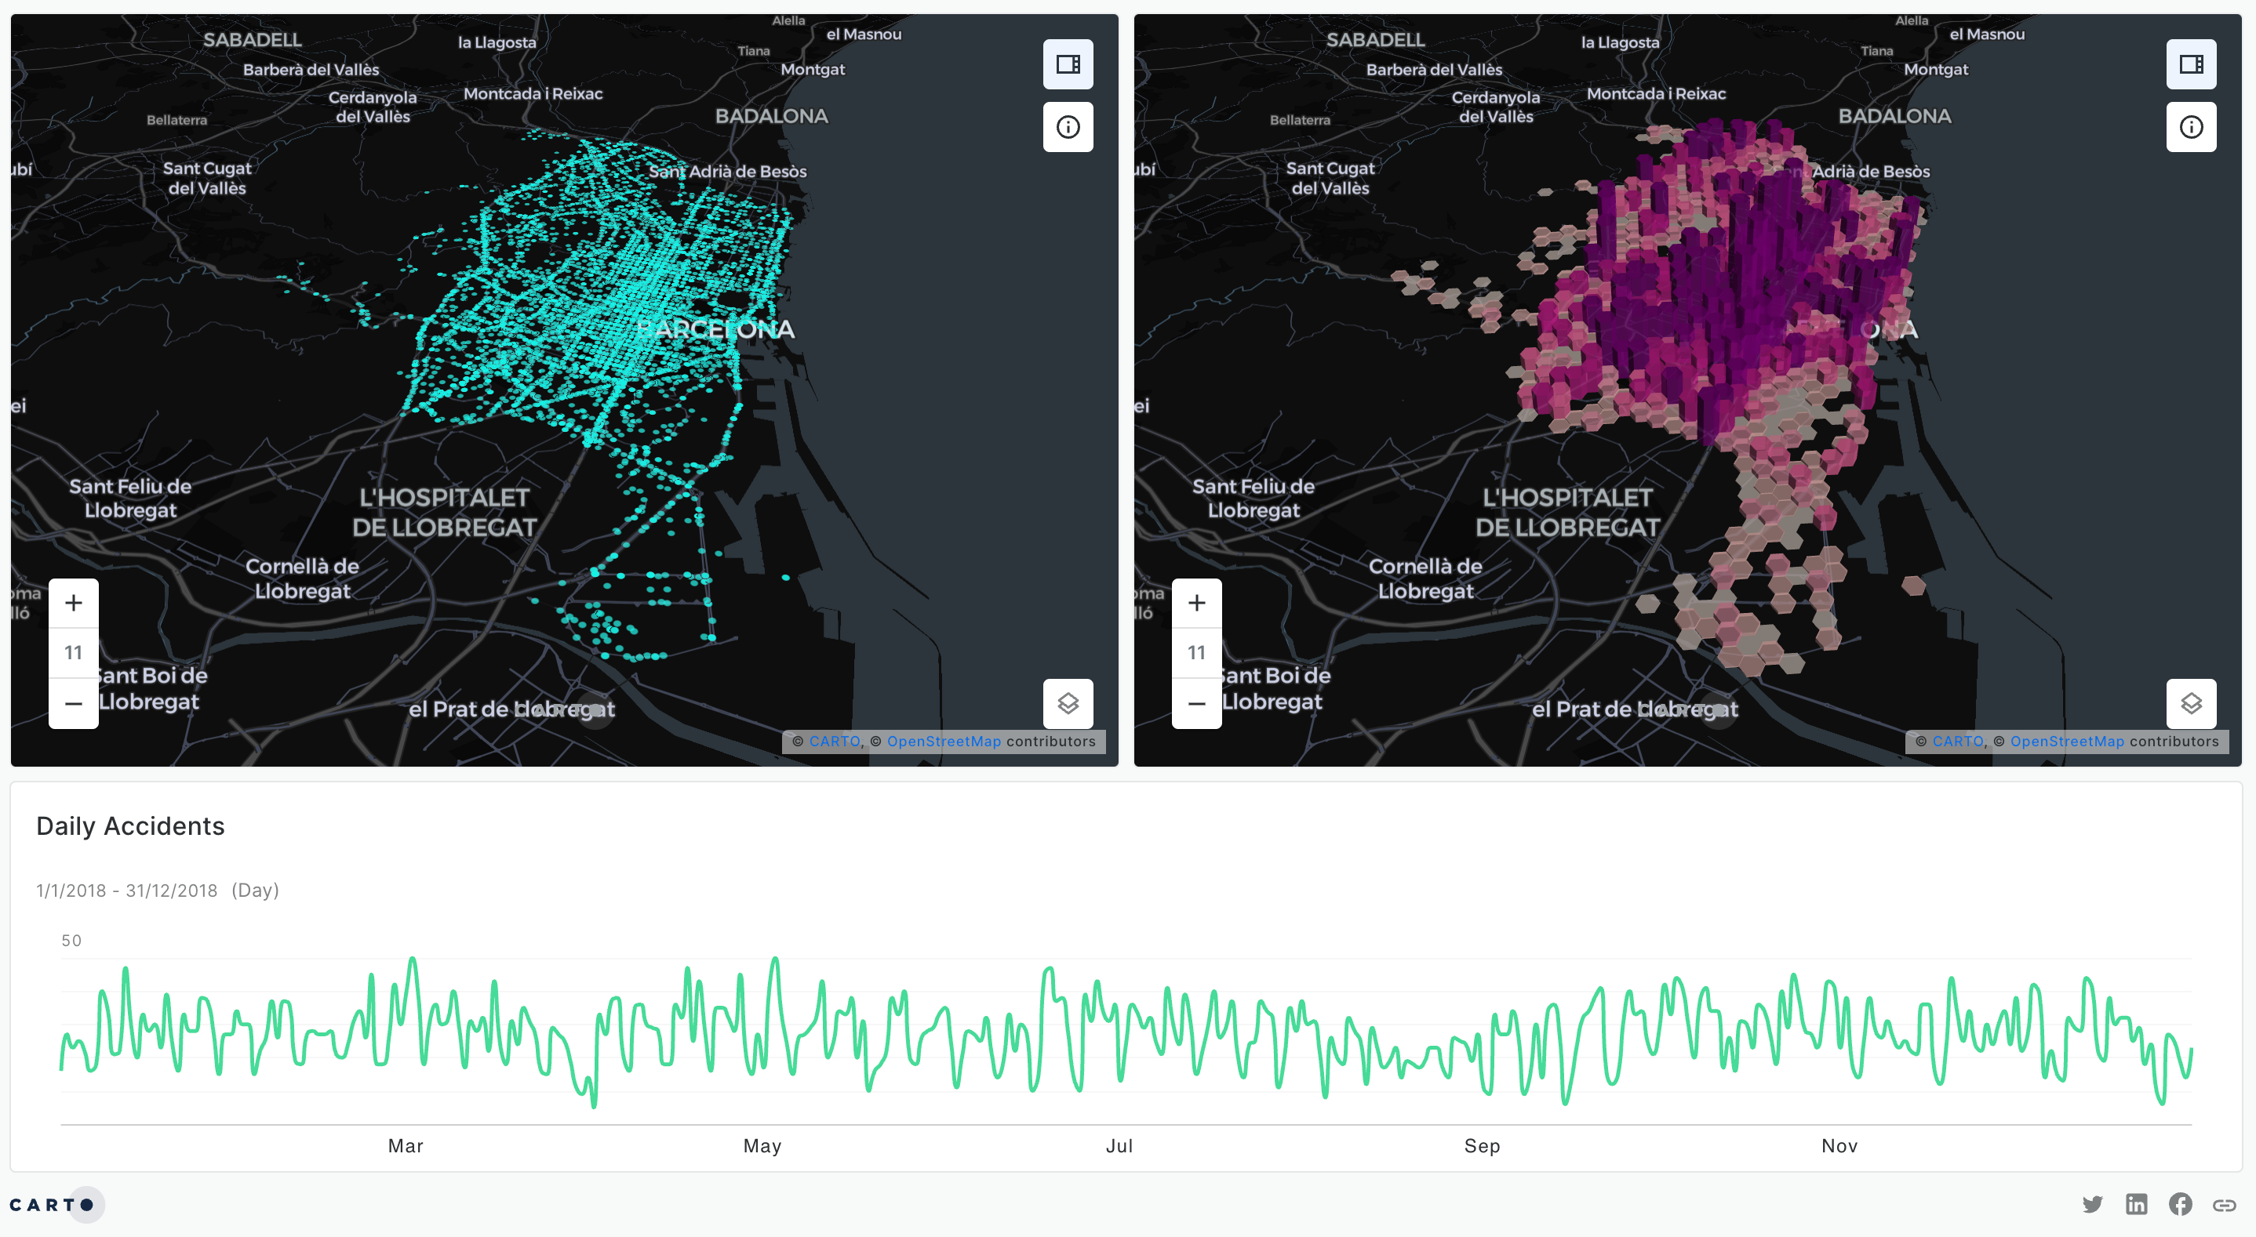
Spatiotemporal analysis plays a crucial role in extracting meaningful insights from data that possess both spatial and temporal components. This example shows how to identify space-time hotspots using the Analytics Toolbox.
STATISTICS
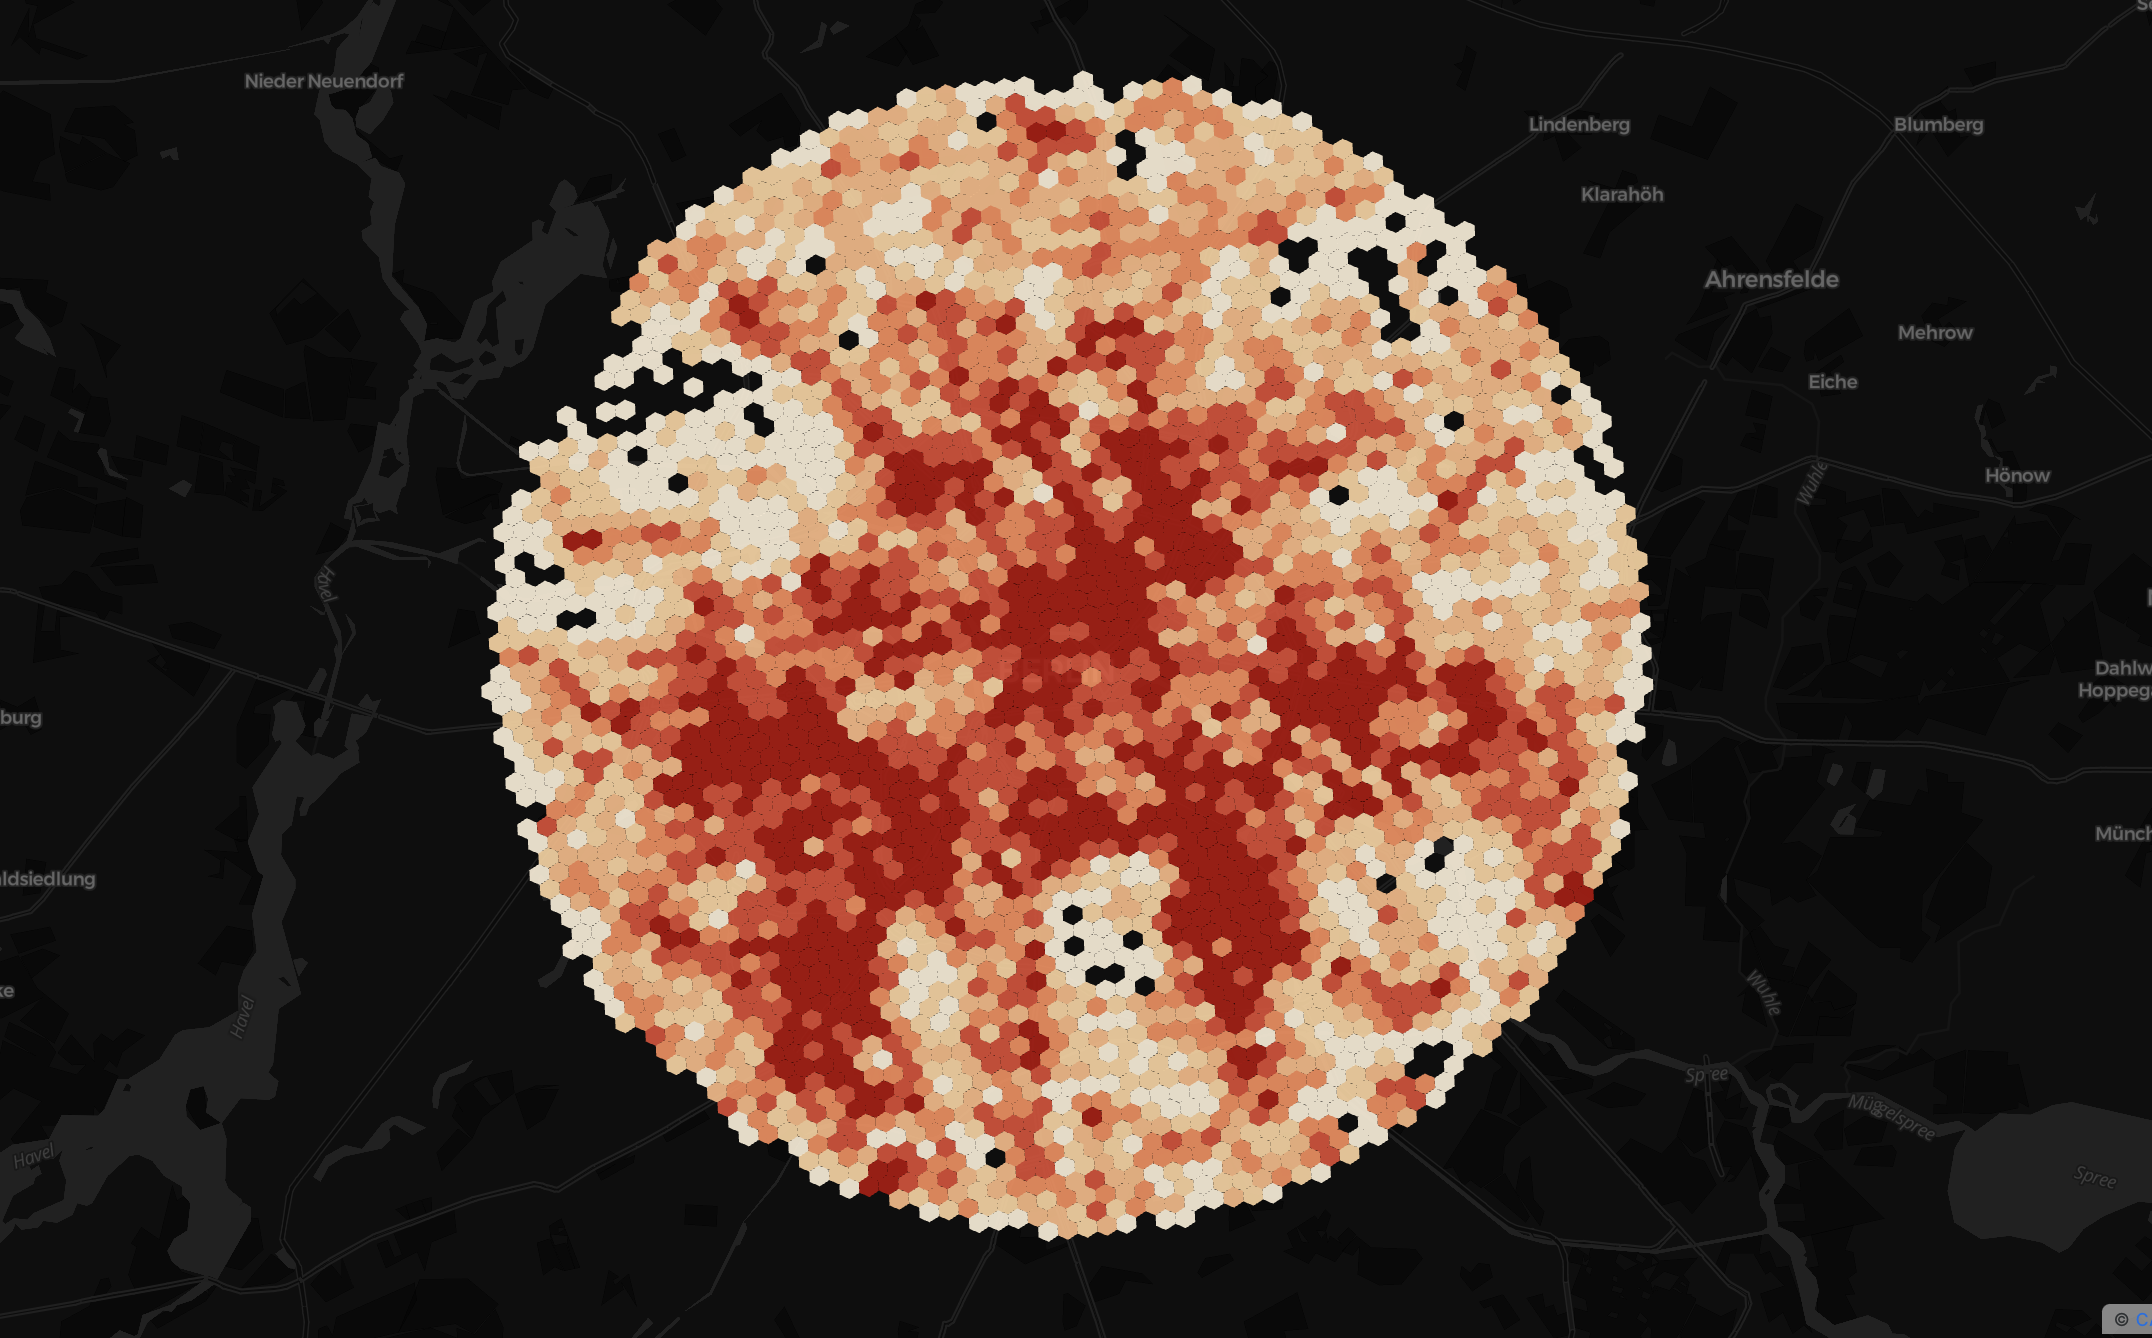
In this example, we analyze the spatial correlation of POI locations in Berlin using OpenStreetMap data and the MORANS_I_H3 function available in the statistics module.
STATISTICS
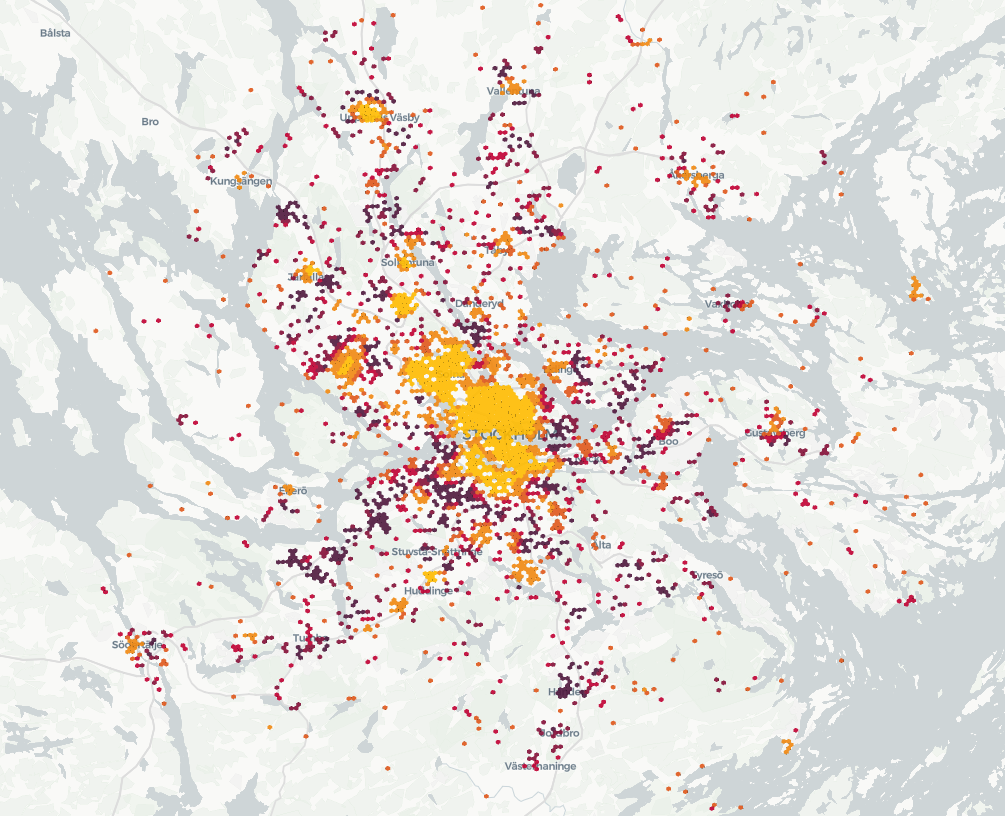
In this example we identify hotspots of amenity POIs in Stockholm using OpenStreetMap data and the GETIS_ORD_H3 procedure of the statistics module.
STATISTICS
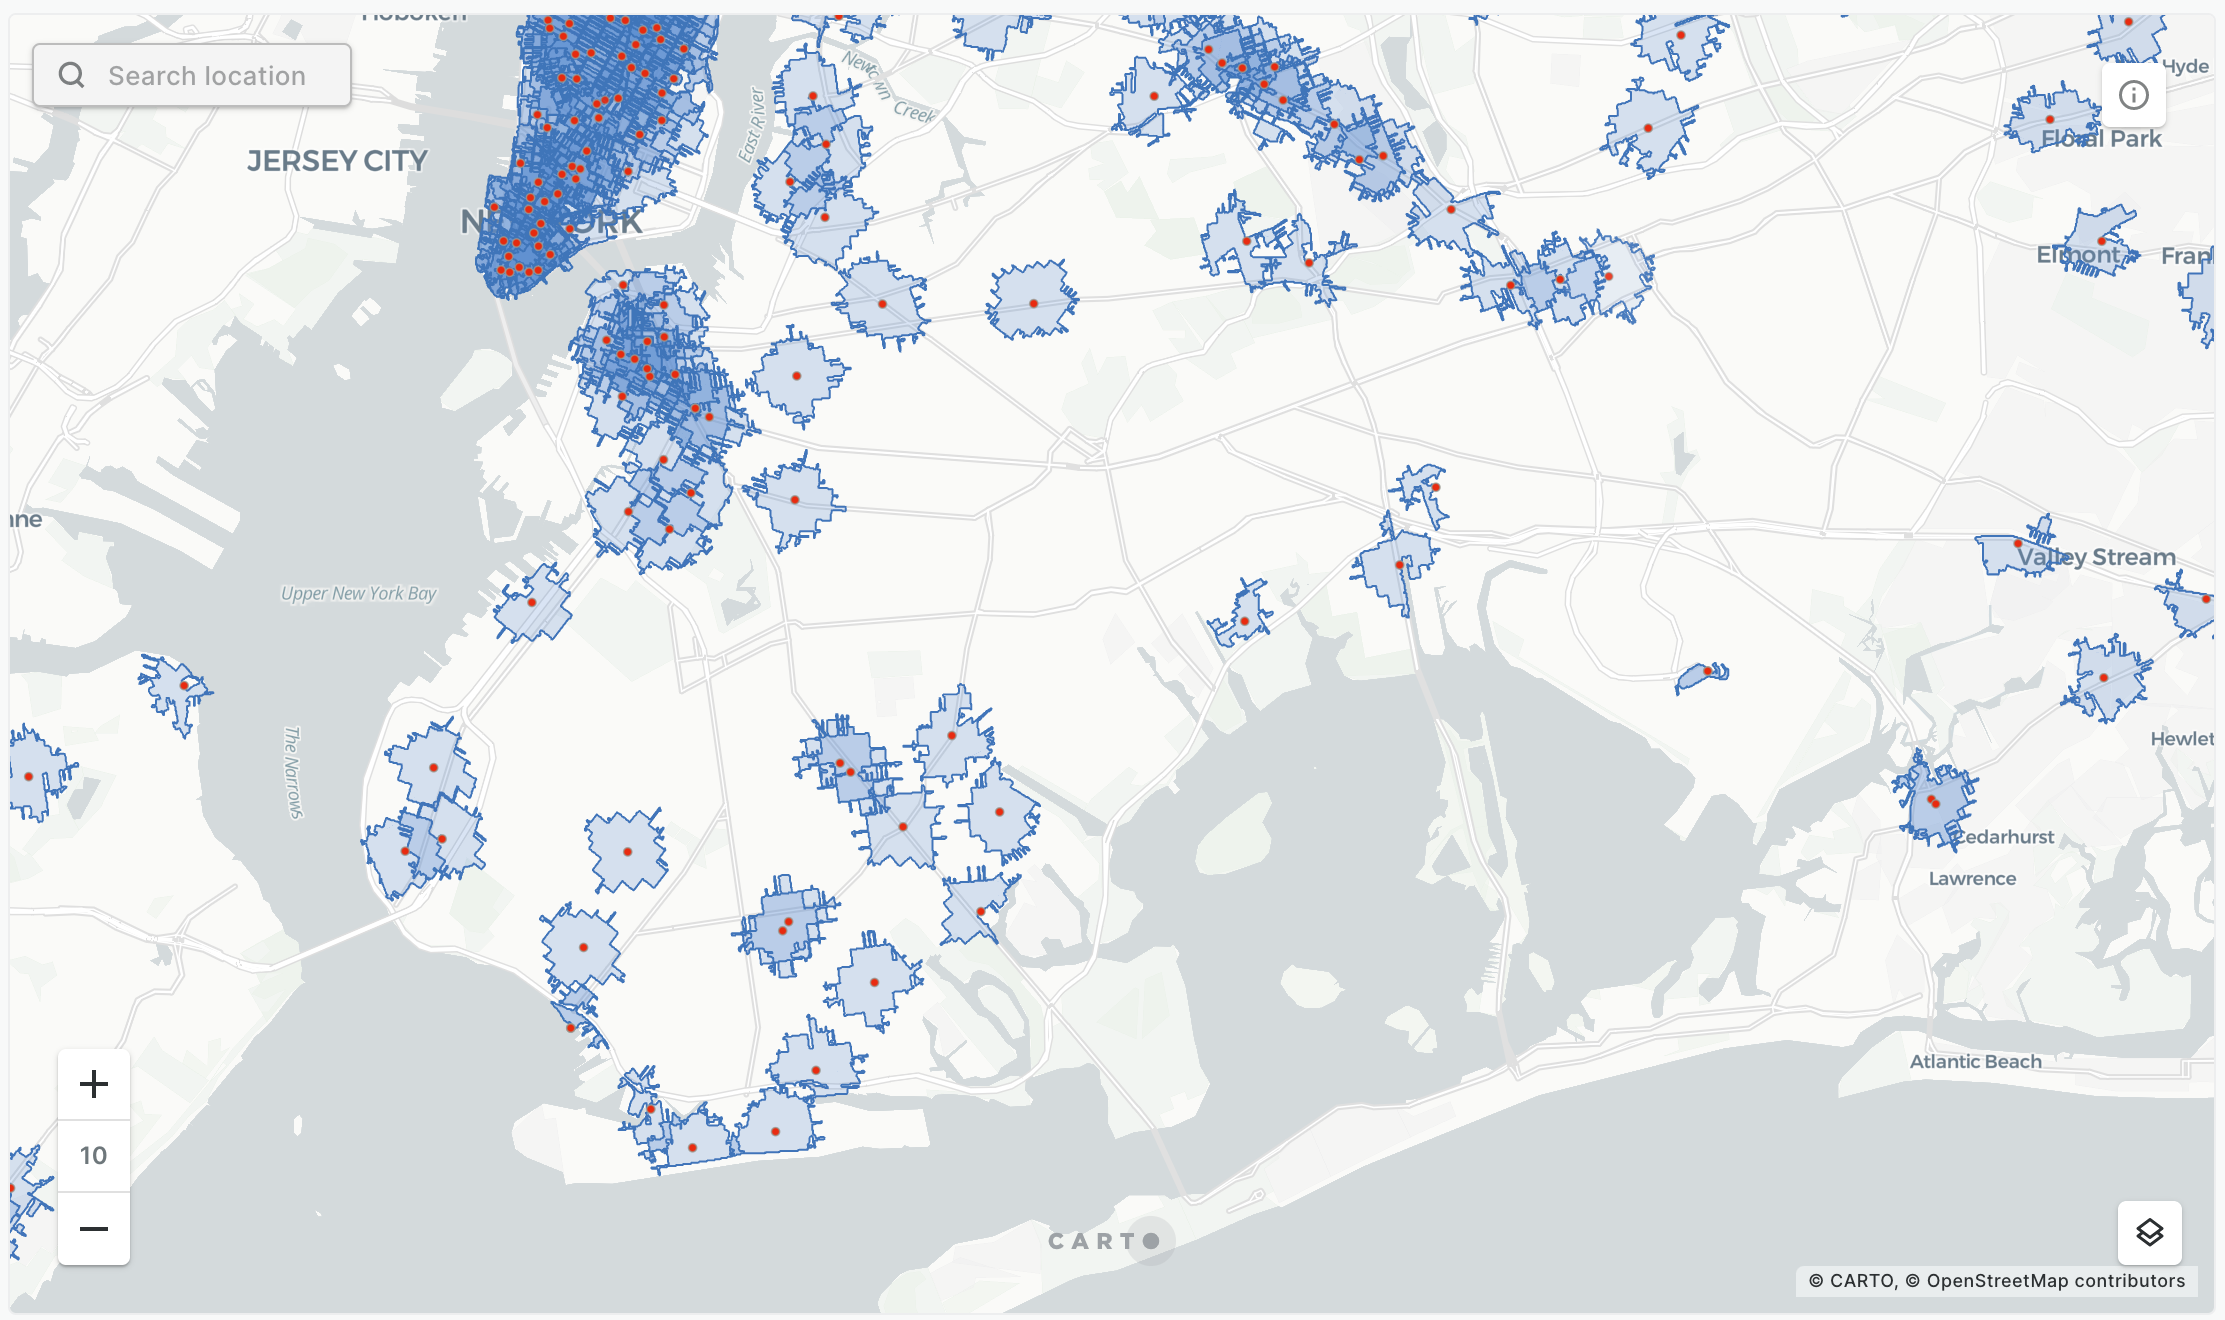
We generate trade areas based on drive/walk-time isolines from Snowflake console and from CARTO Builder.
LDS
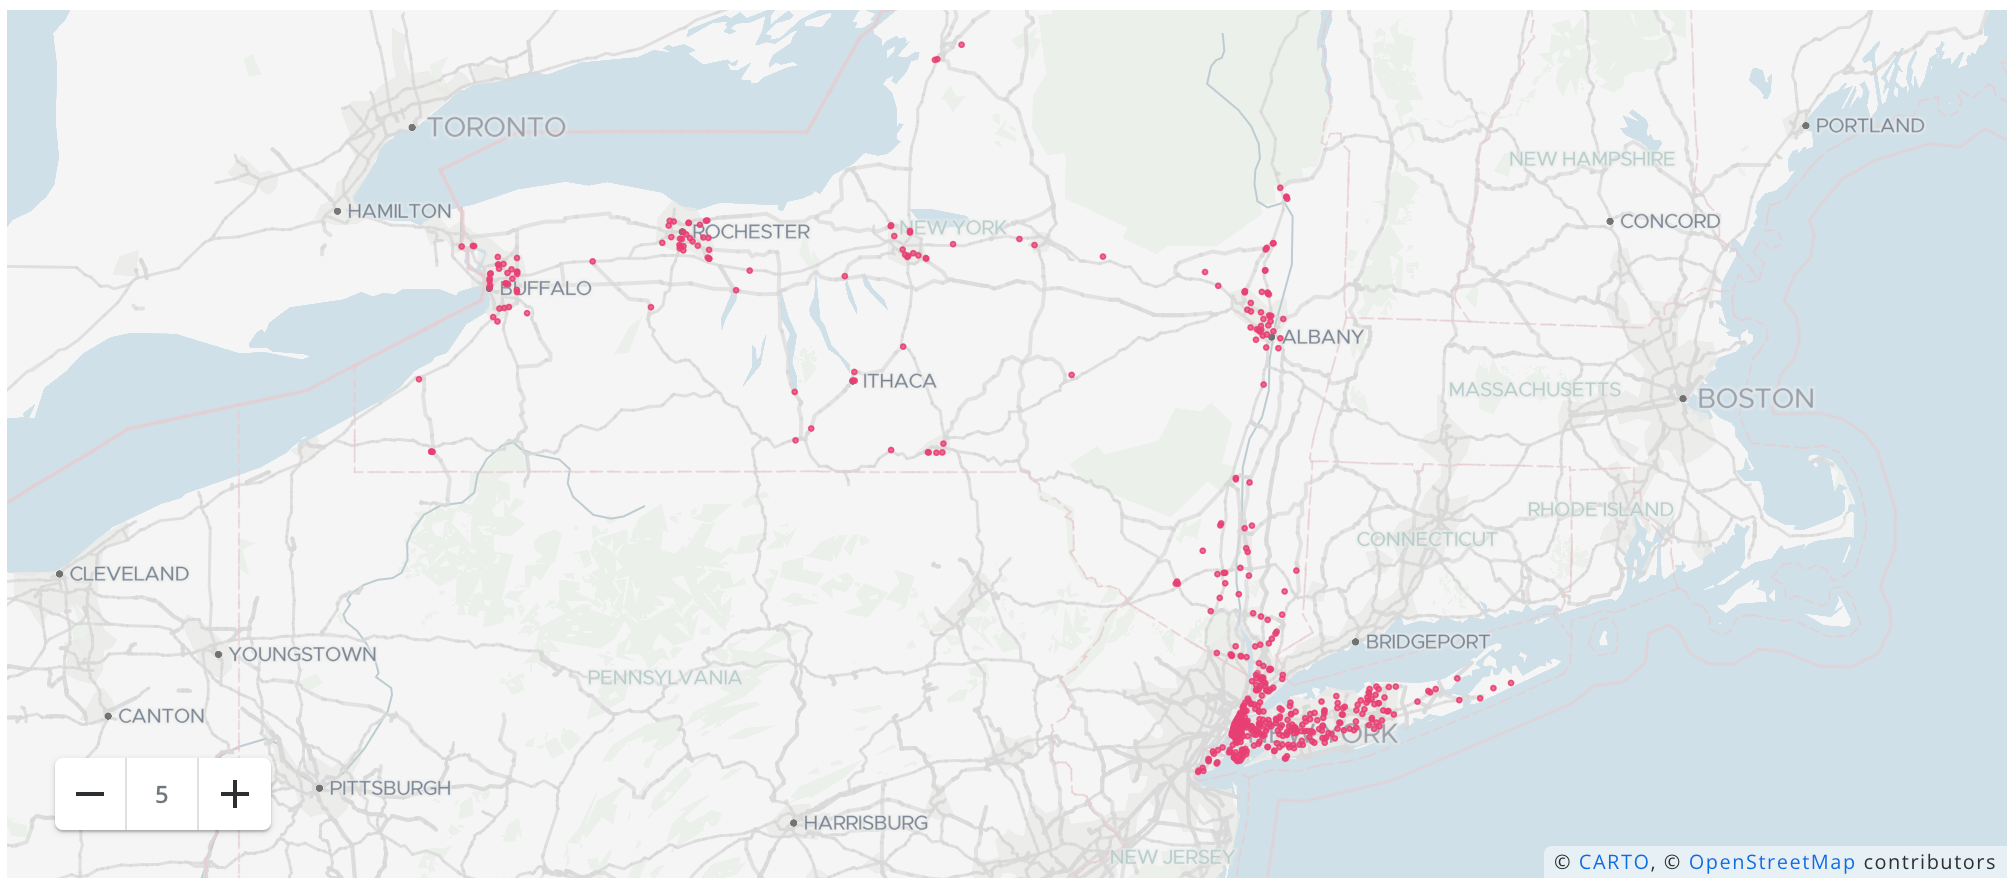
We provide an example that showcase how to easily geocode your address data using the Analytics Toolbox LDS module from the Snowflake console and from the CARTO Workspace.
LDS
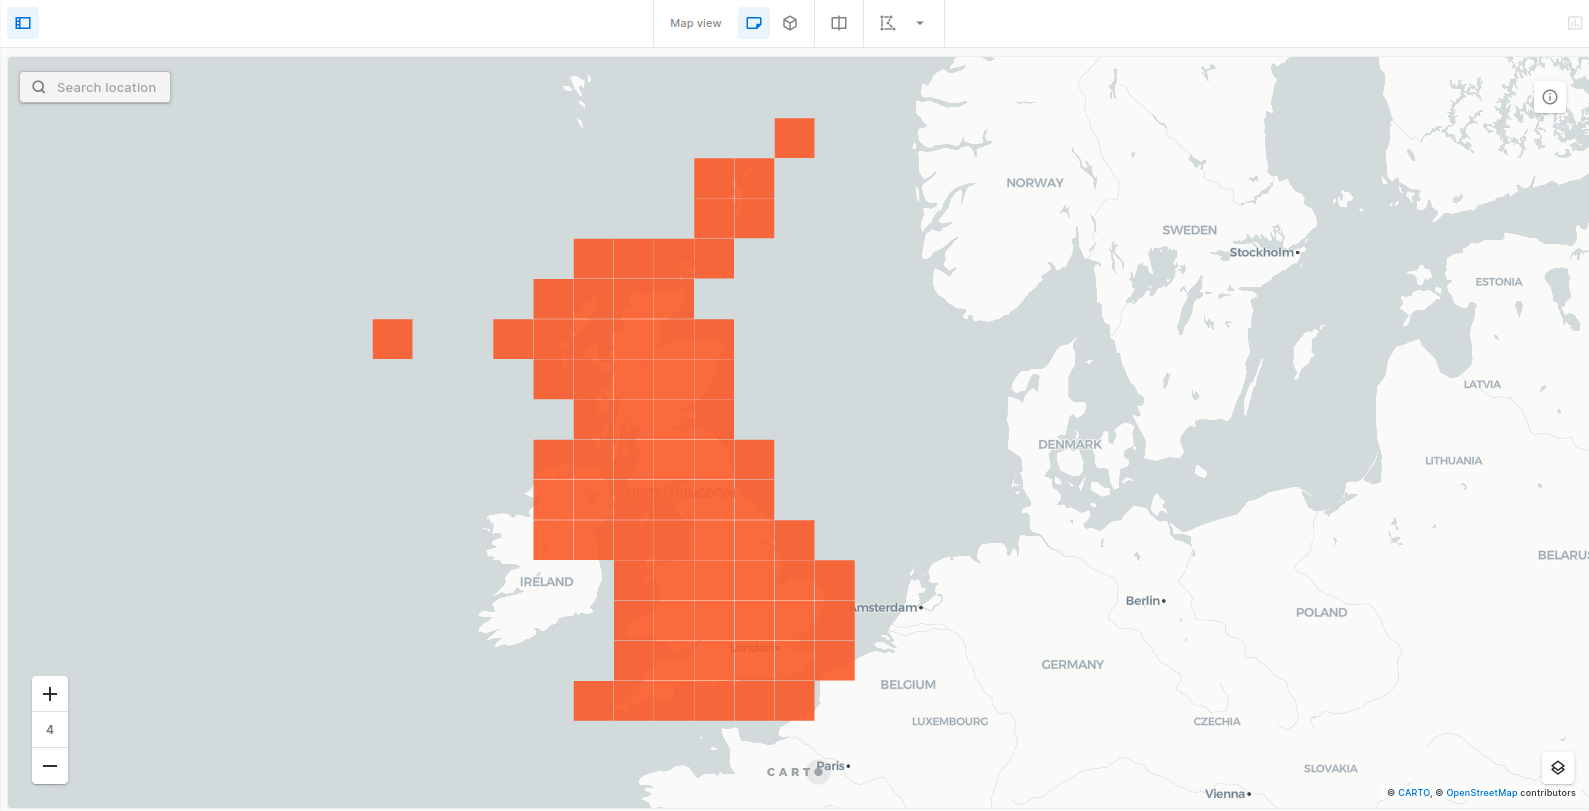
We provide a set of examples that showcase how to easily create tilesets based on spatial indexes allowing you to process and visualize very large spatial datasets stored in Snowflake. You should use this procedure if you have a dataset that...
TILER
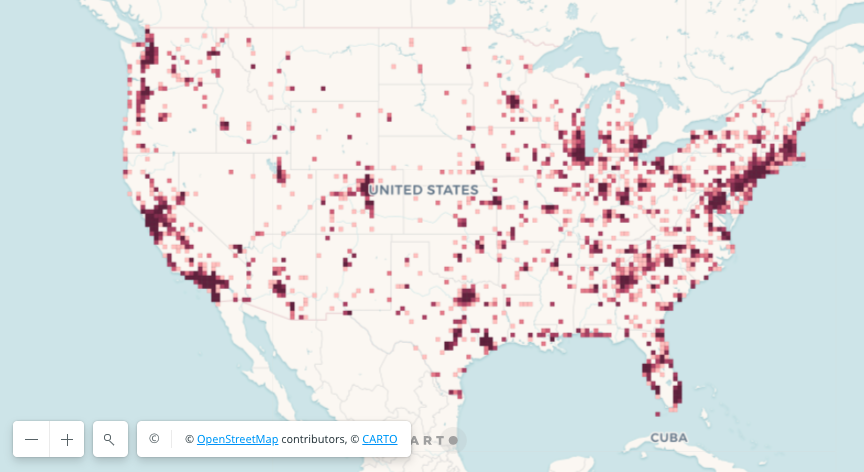
We are going to demonstrate how fast and easy it is to make a visualization of a Quadkey grid to identify the concentration of Starbucks locations in the US.
QUADBIN
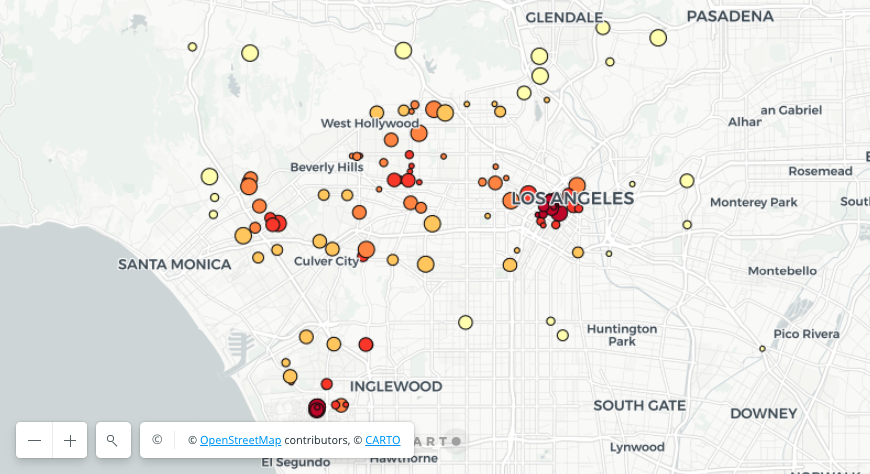
In this example we are going to showcase how to use the Minkowski distance to evaluate cannibalization across Starbucks stores in Los Ángeles, assuming that the ratio of cannibalization depends on the nearby store
MEASUREMENTS
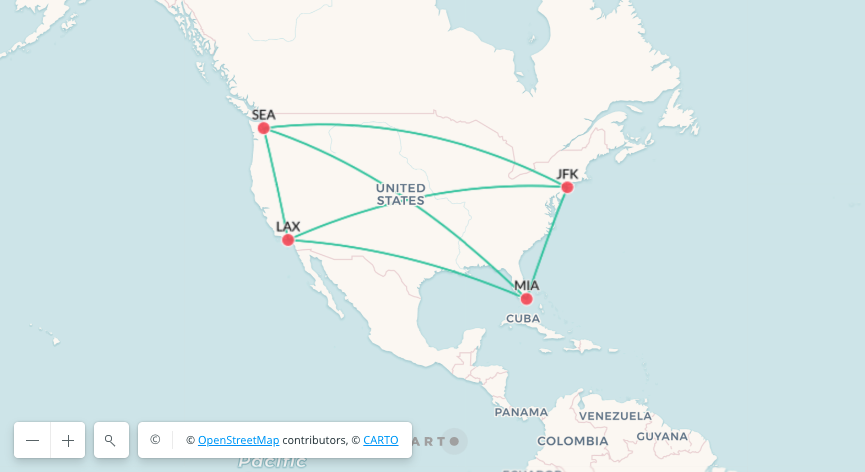
In this example we will showcase how easily we can compute all the paths that interconnect the main four US airports using the Analytics Toolbox.
TRANSFORMATIONS
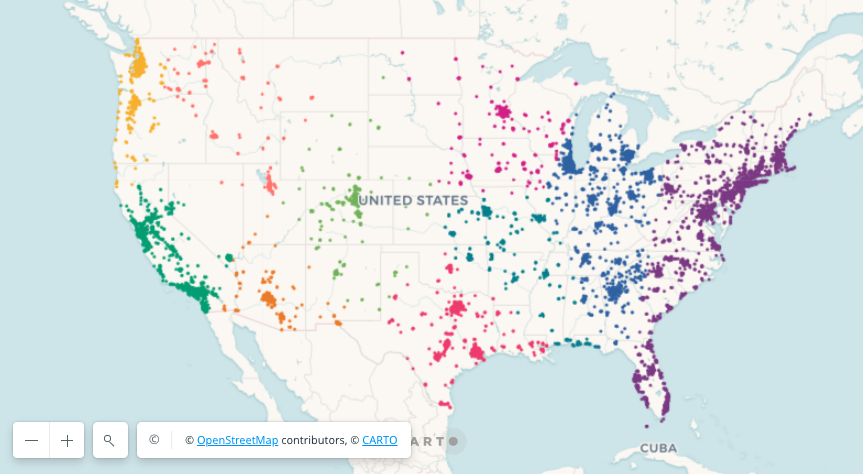
In this example we are going to use points clustering to analyze where to locate 10 new supplier offices in US so they can best serve all Starbucks locations.
CLUSTERING
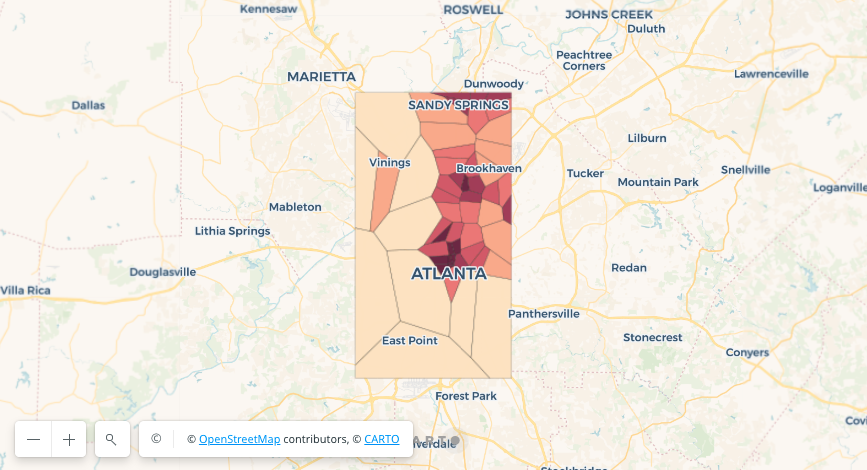
Voronoi diagrams are a very useful tool to build influence regions from a set of points and the Analytics Toolbox provides a convenient function to build them. An example application of these diagrams is the calculation of the coverage area...
PROCESSING
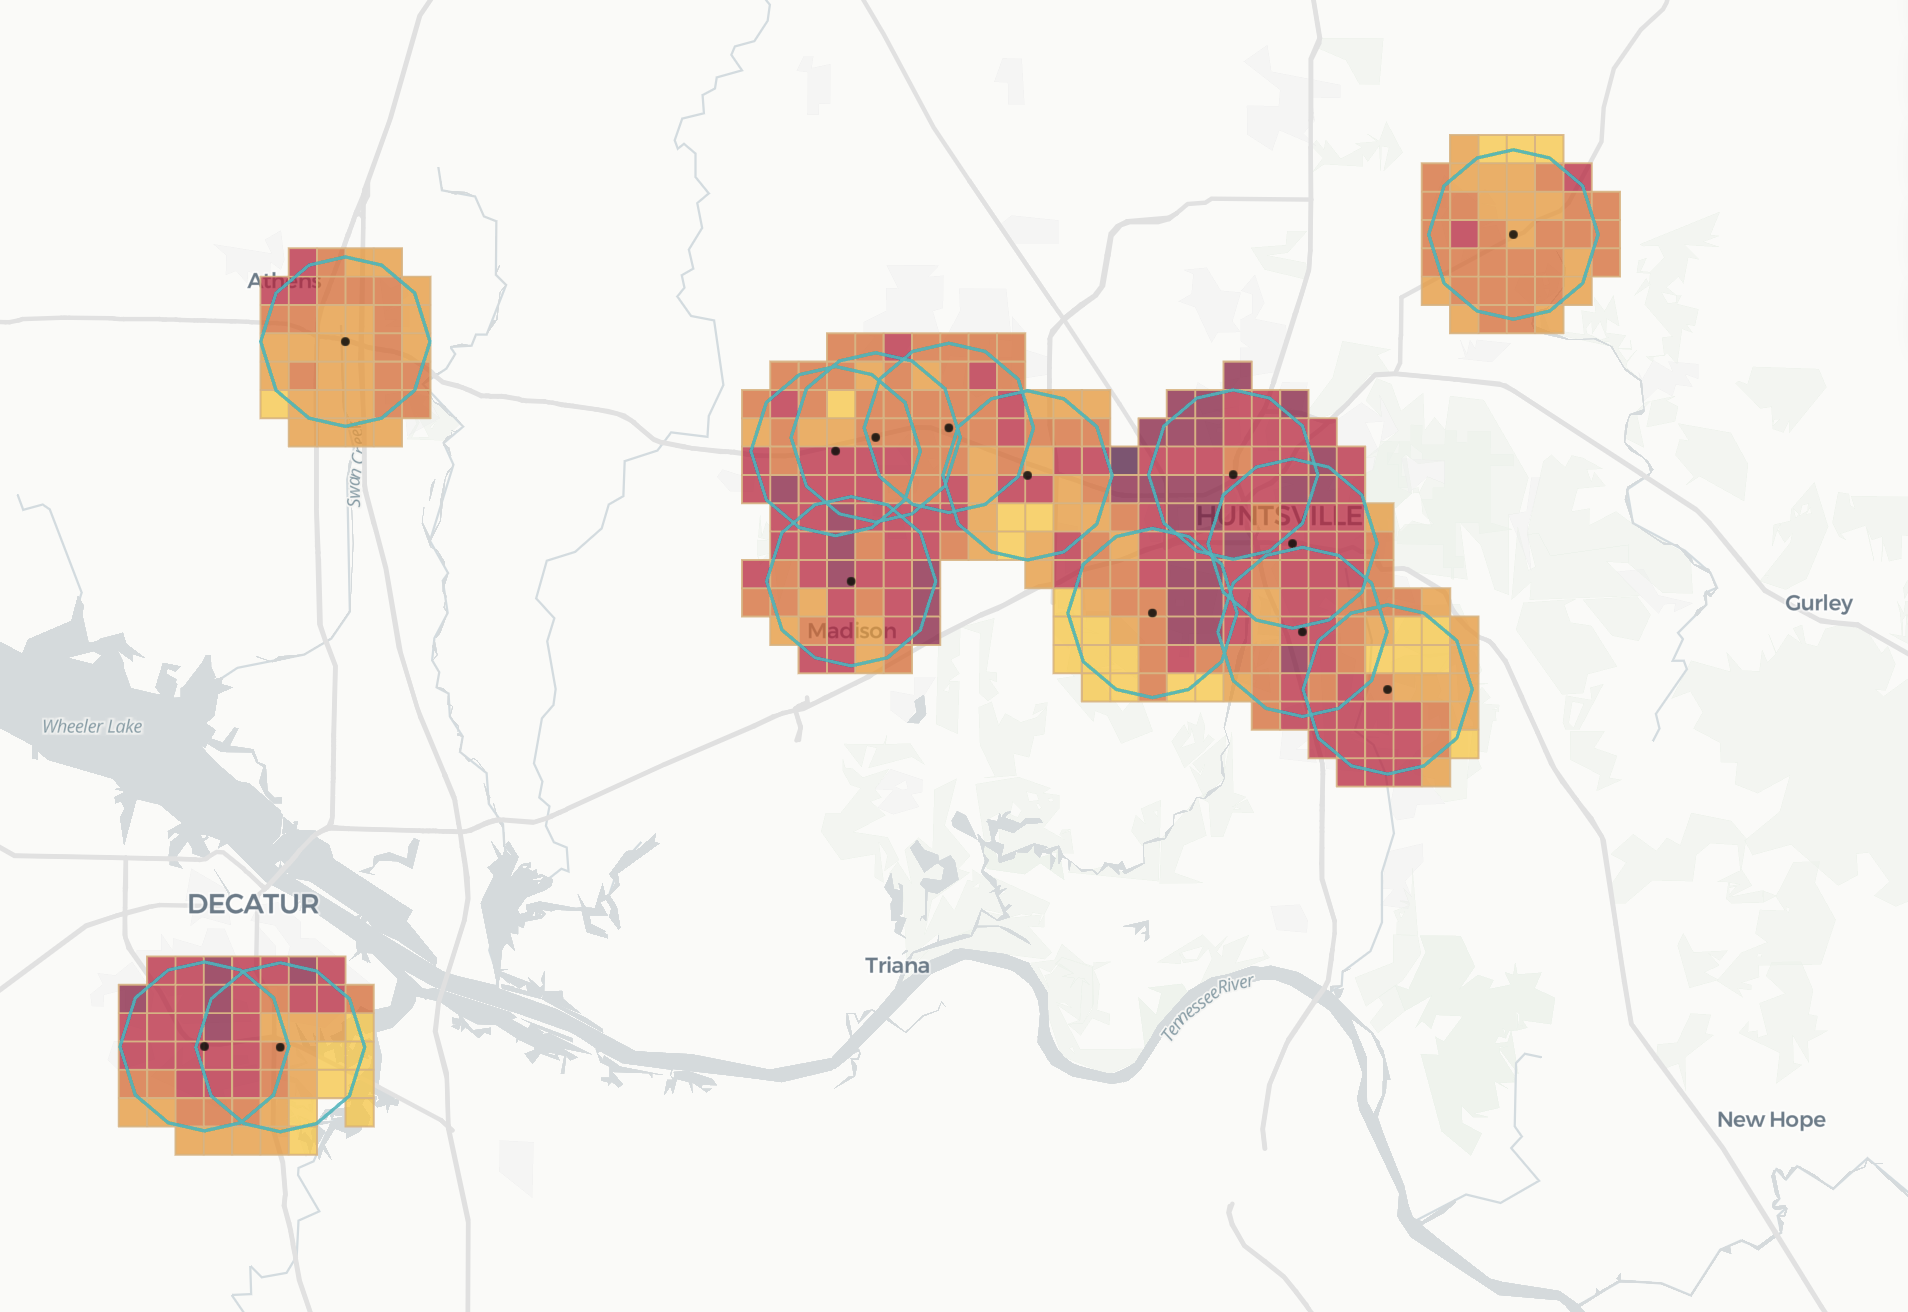
In this example we are going to characterize all Starbucks locations in the US by the total population covered by their catchment areas. We are going to define these catchment areas as a 3km buffer around each store.
DATA

In this guide you will learn how to perform data enrichment using data from your Data Observatory subscriptions and the different data enrichment methods available in the Analytics Toolbox.
DATA
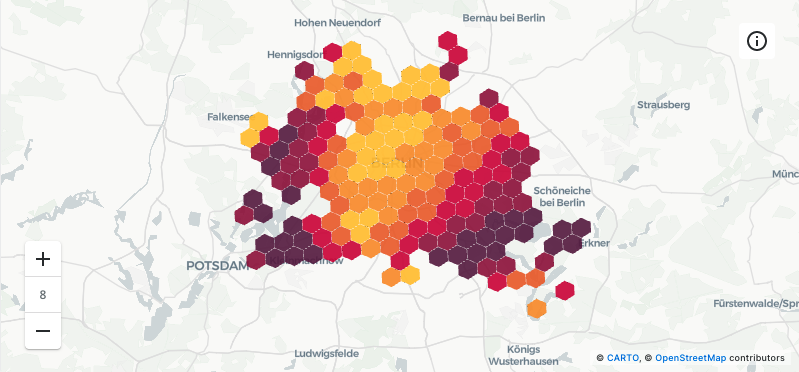
Geographically Weighted Regression (GWR) is a statistical regression method that models the local (e.g. regional or sub-regional) relationships between a set of predictor variables and an outcome of interest. Therefore, it should be used in lieu of a global model in those scenarios where these relationships vary spatially. In this example we are going to analyze the local relationships between Airbnb's listings in Berlin and the number of bedrooms and bathrooms available at these listings using the GWR_GRID procedure.
STATISTICS
European Union’s Horizon 2020 research and innovation programme under grant agreement No 960401.
Last updated
Was this helpful?


