Finding stores in areas with weather risks

In this example we use CARTO Workflows to ingest data from a remote file containing temperature forecasts in the US together with weather risk data from NOAA, and data with the location of our stores; we will identify which of the stores are located in areas with weather risks or strong deviations in temperature.
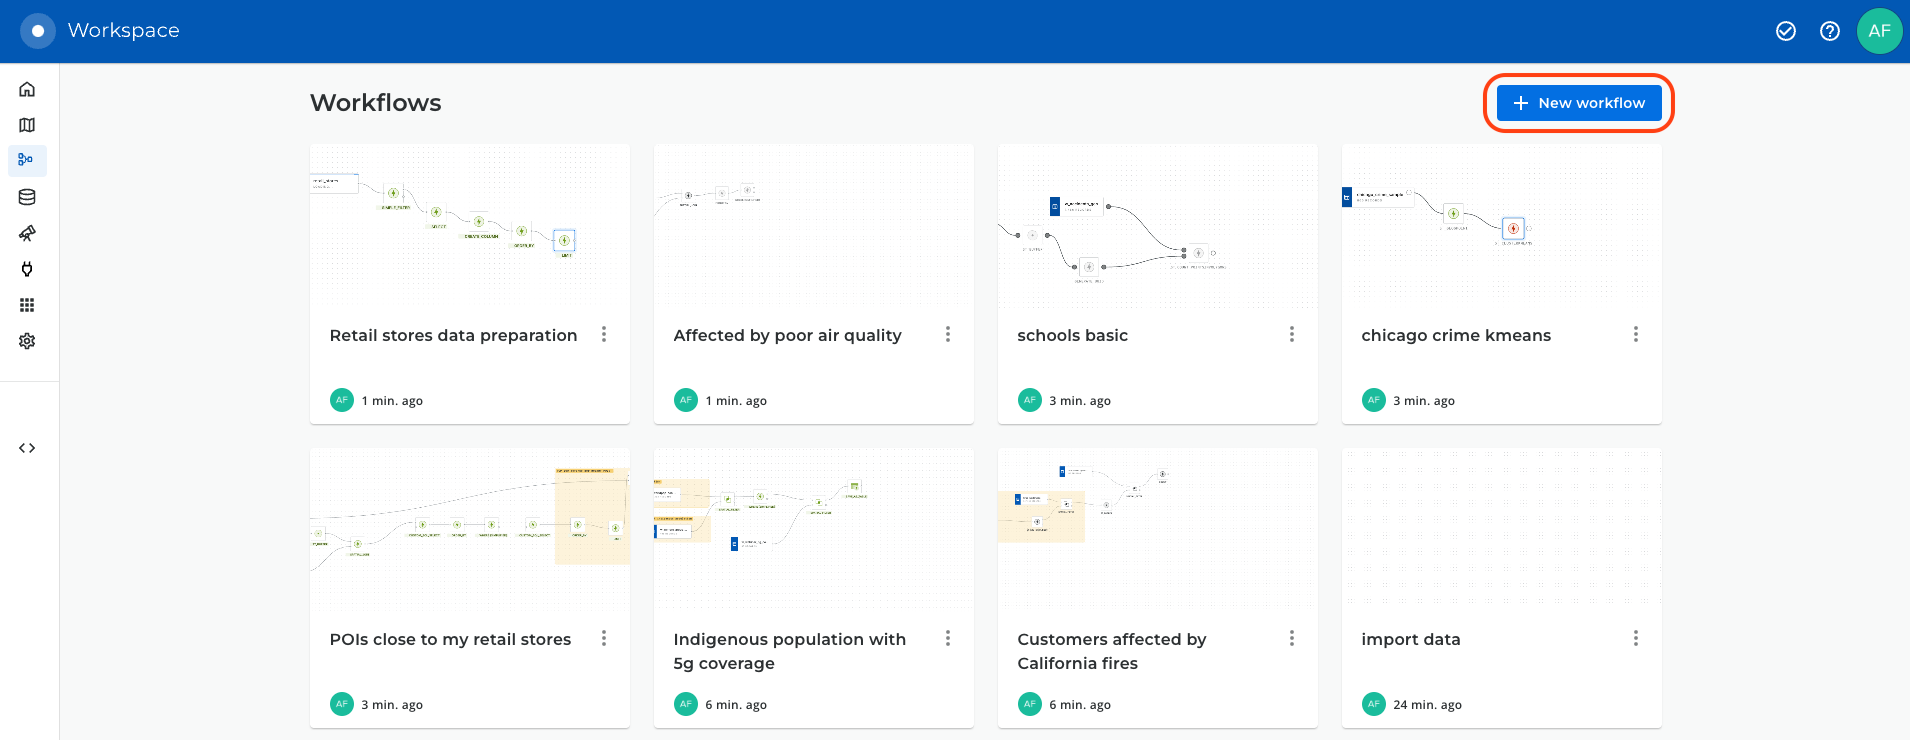
To start creating the workflow, please click on "+ New workflow" in the main page of the Workflows section. If it will be your first workflow, click on "Create your first workflow".
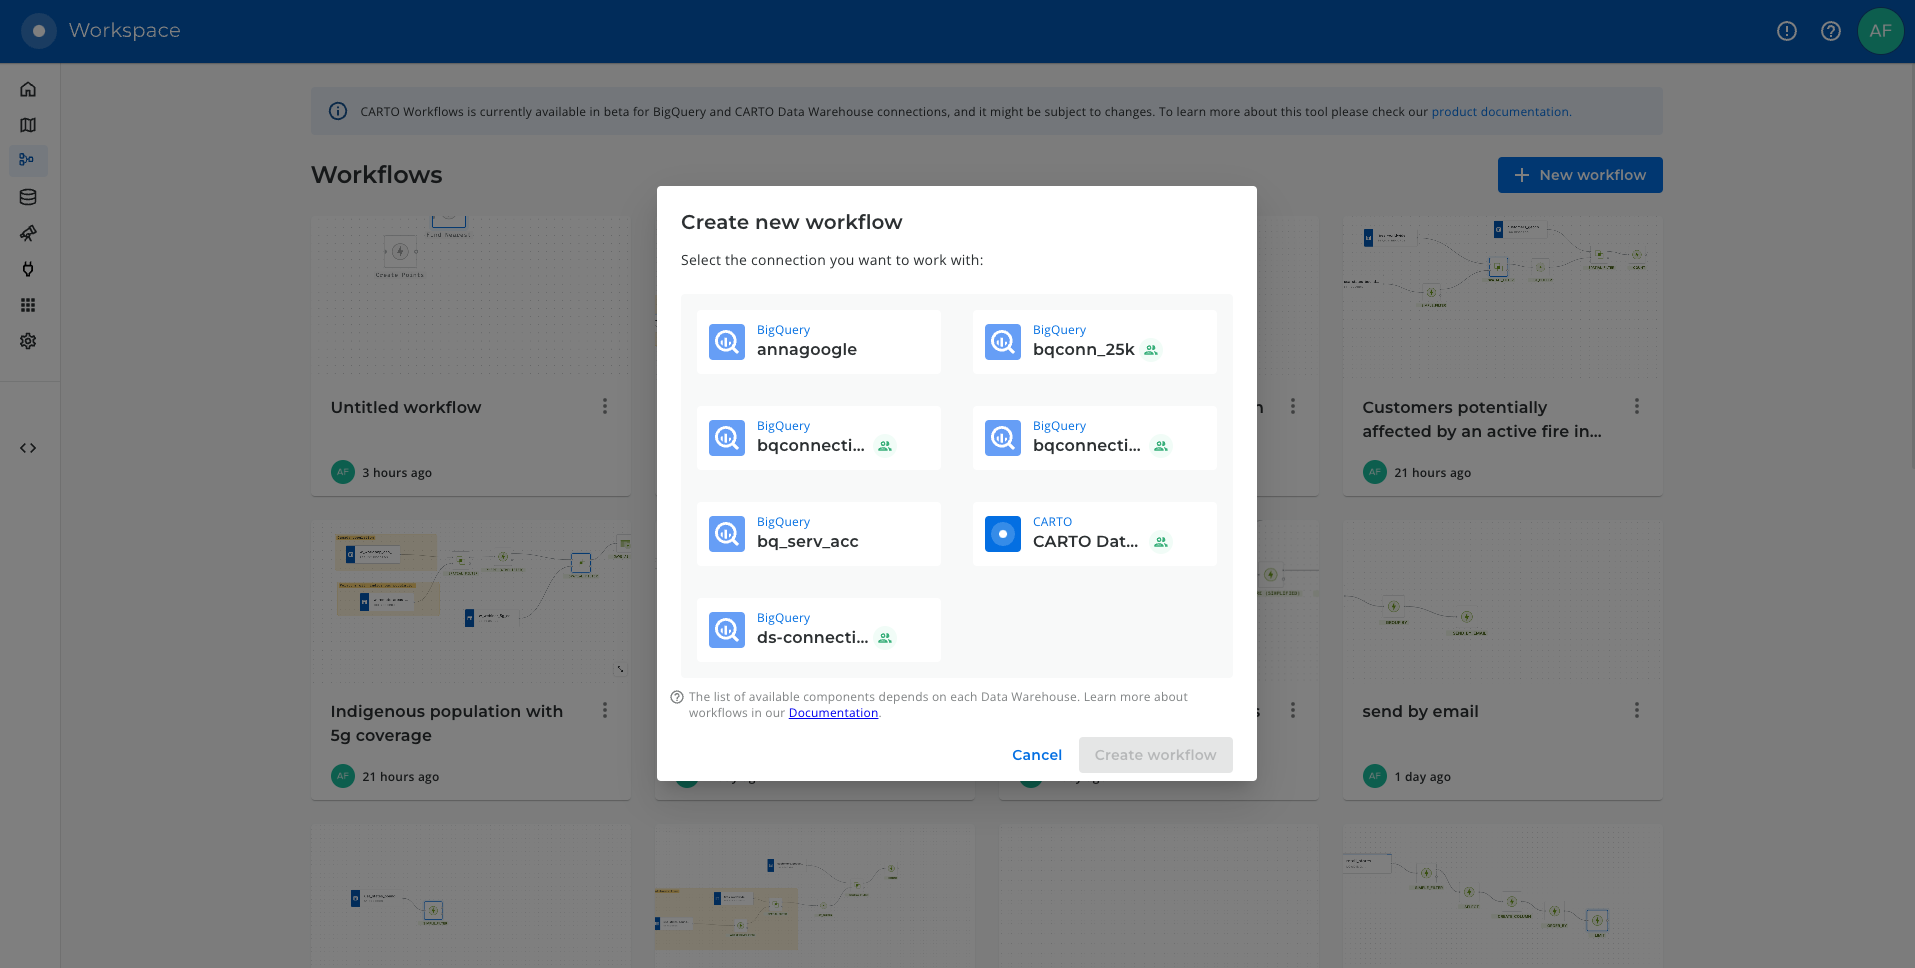
Choose the data warehouse connection that you want to use. In this case, please select the CARTO Data Warehouse connection to find the data sources used in this example.
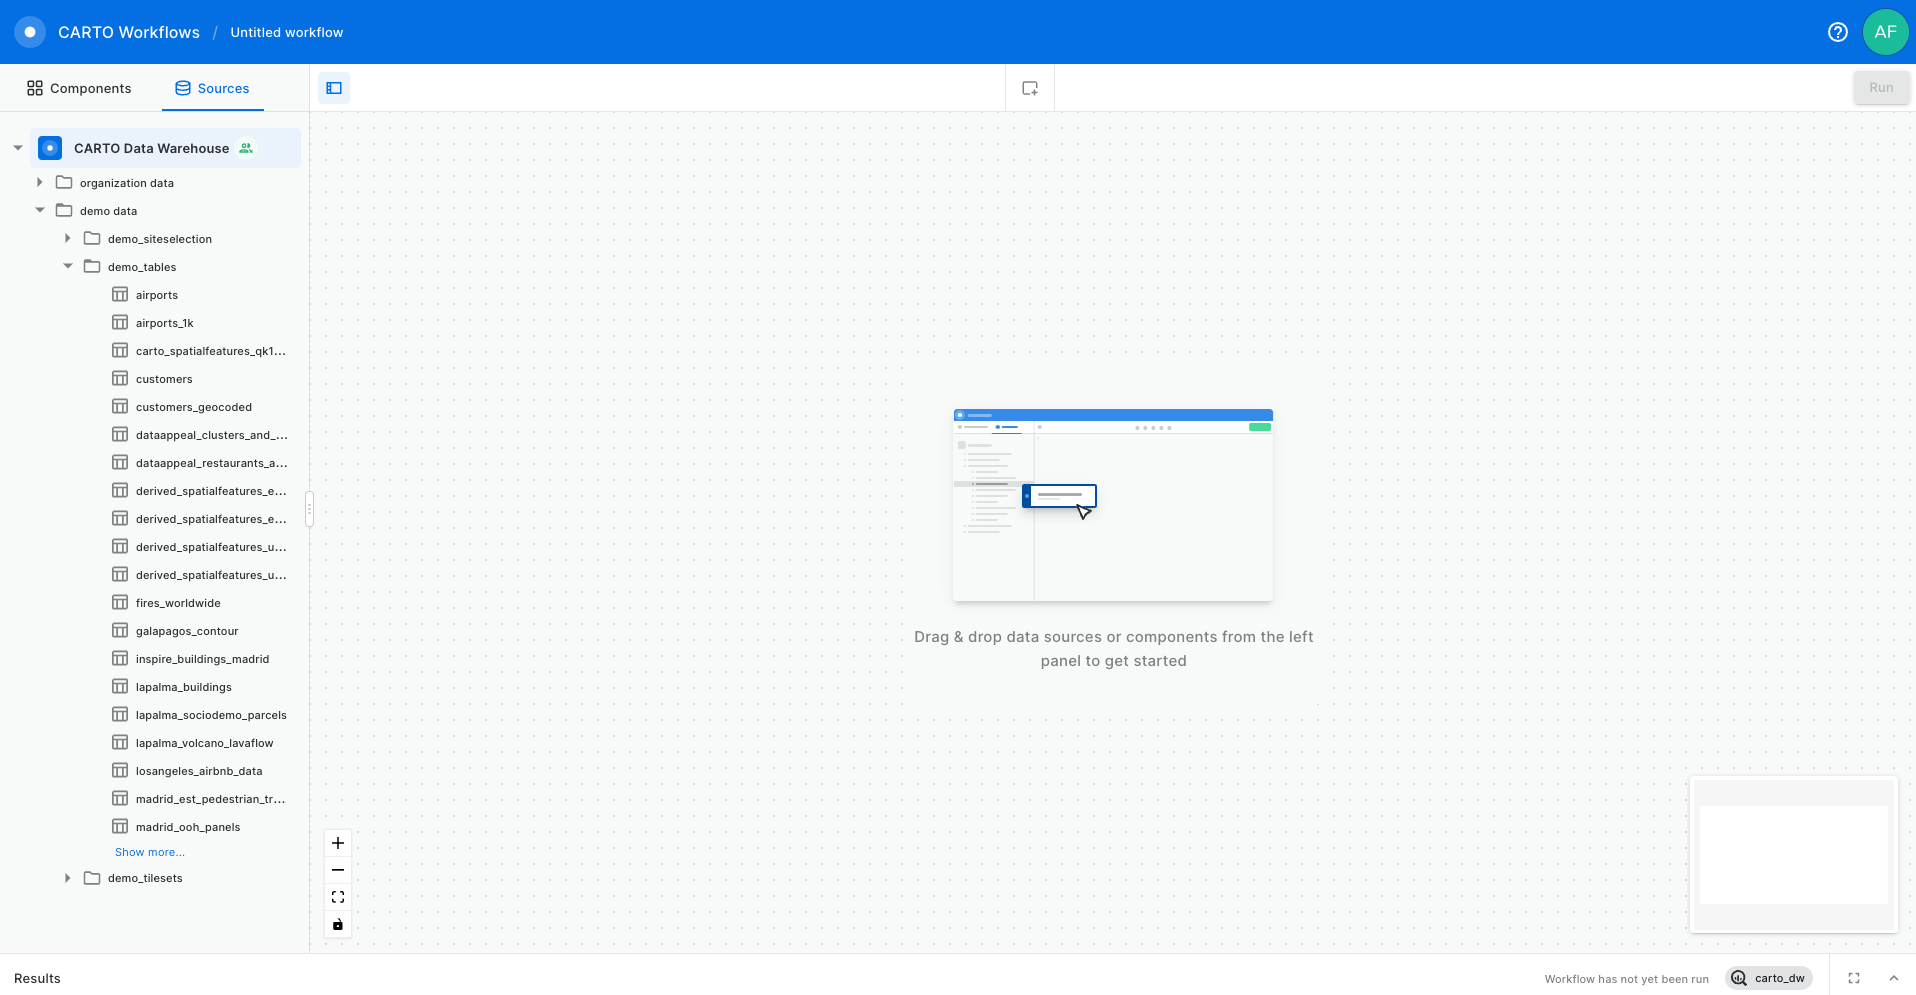
Now you can drag and drop the data sources and components that you want to use from the explorer on the left side of the screen into the Workflow canvas that is located at the center of the interface.
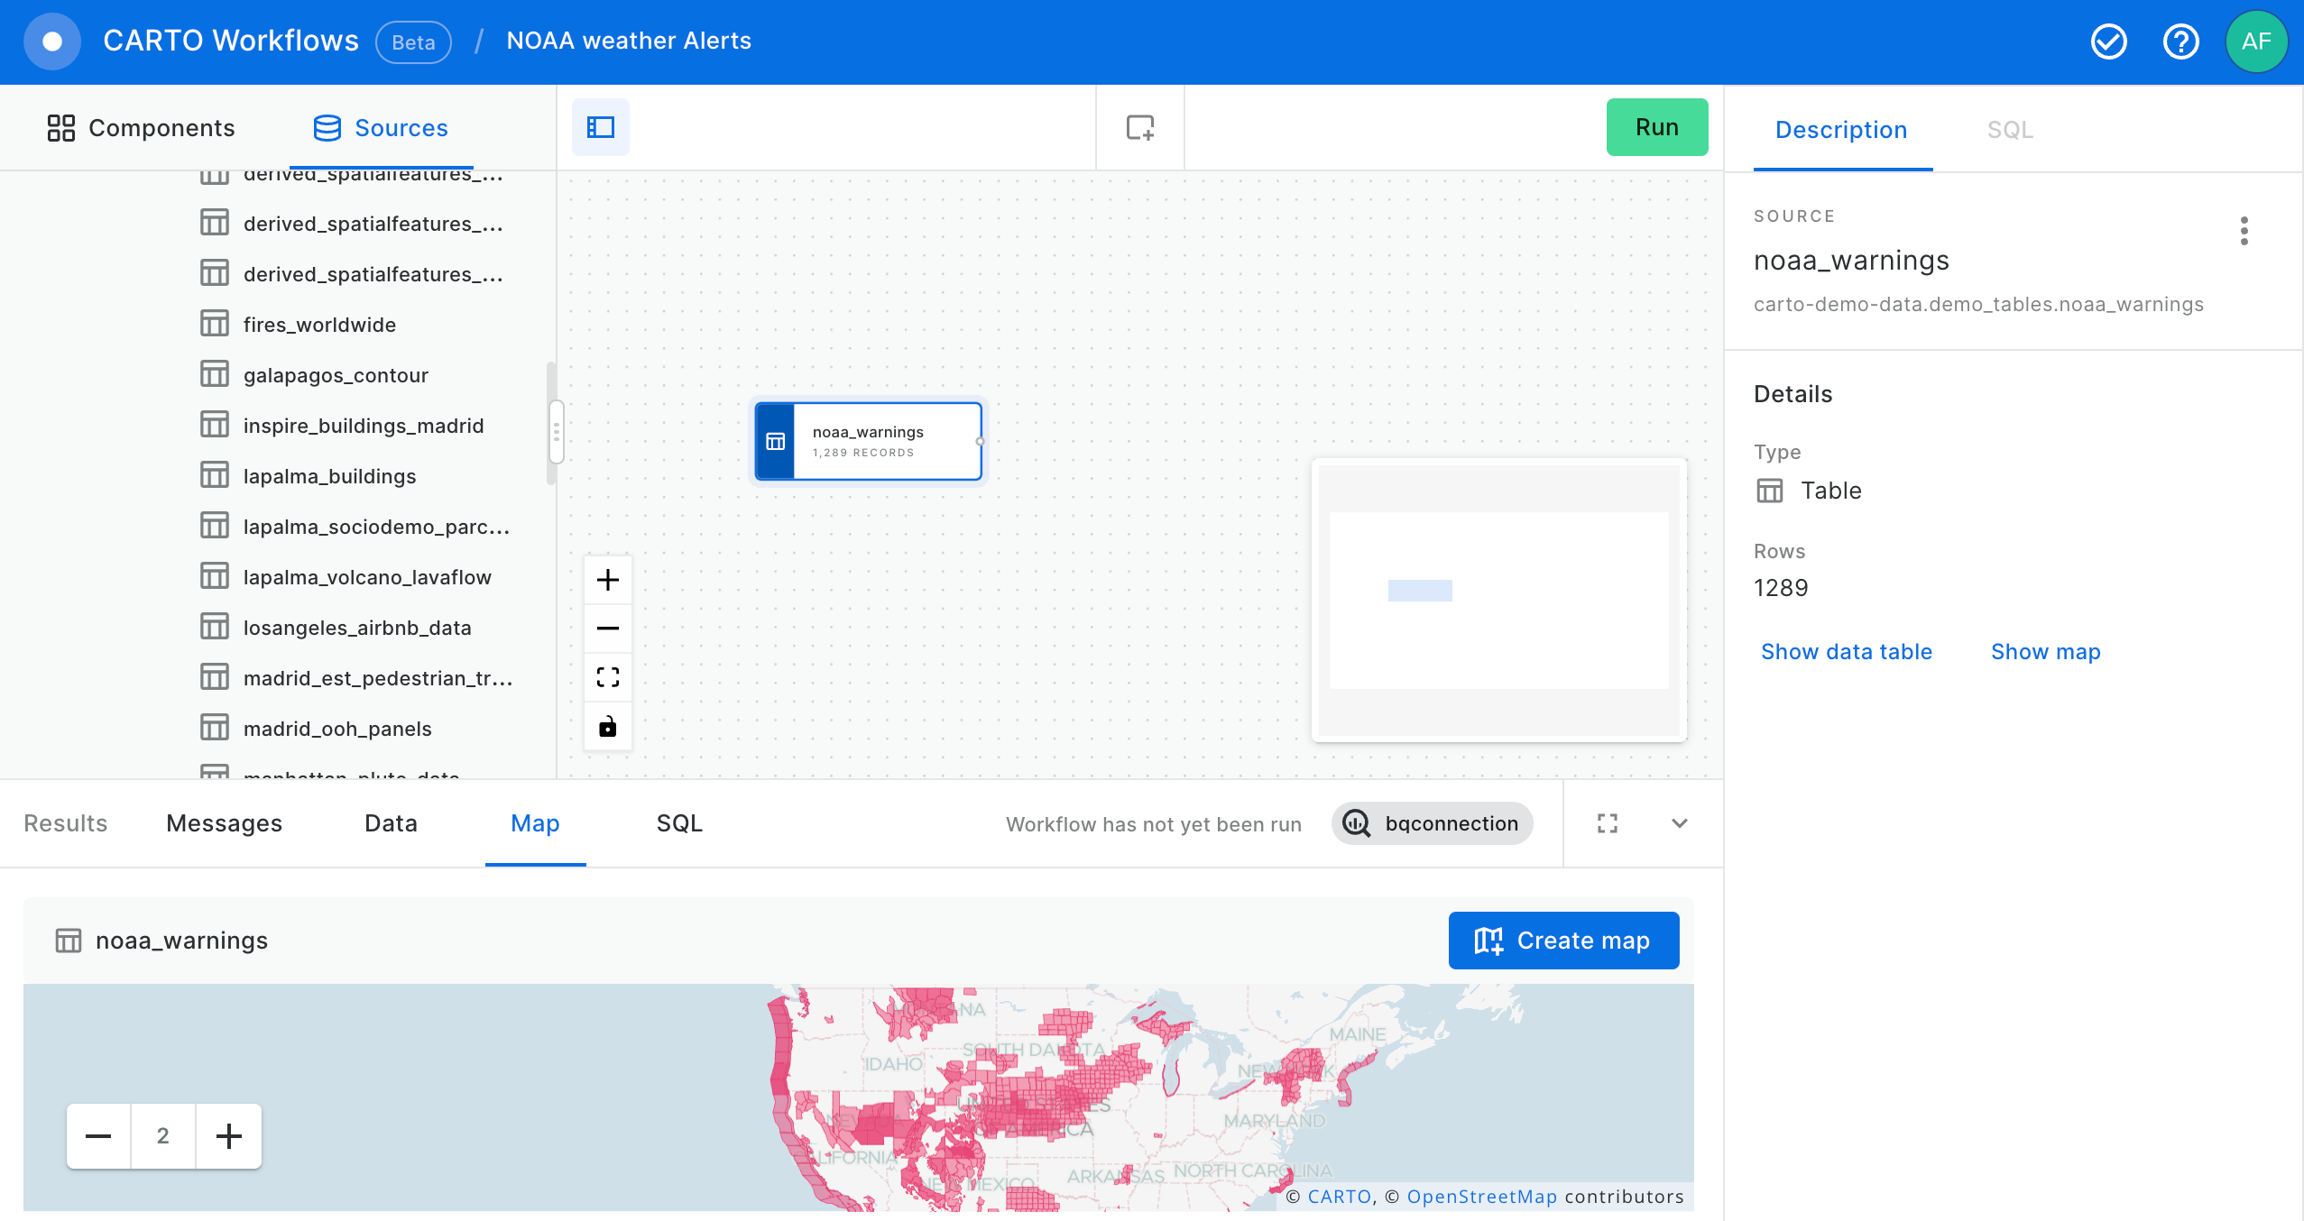
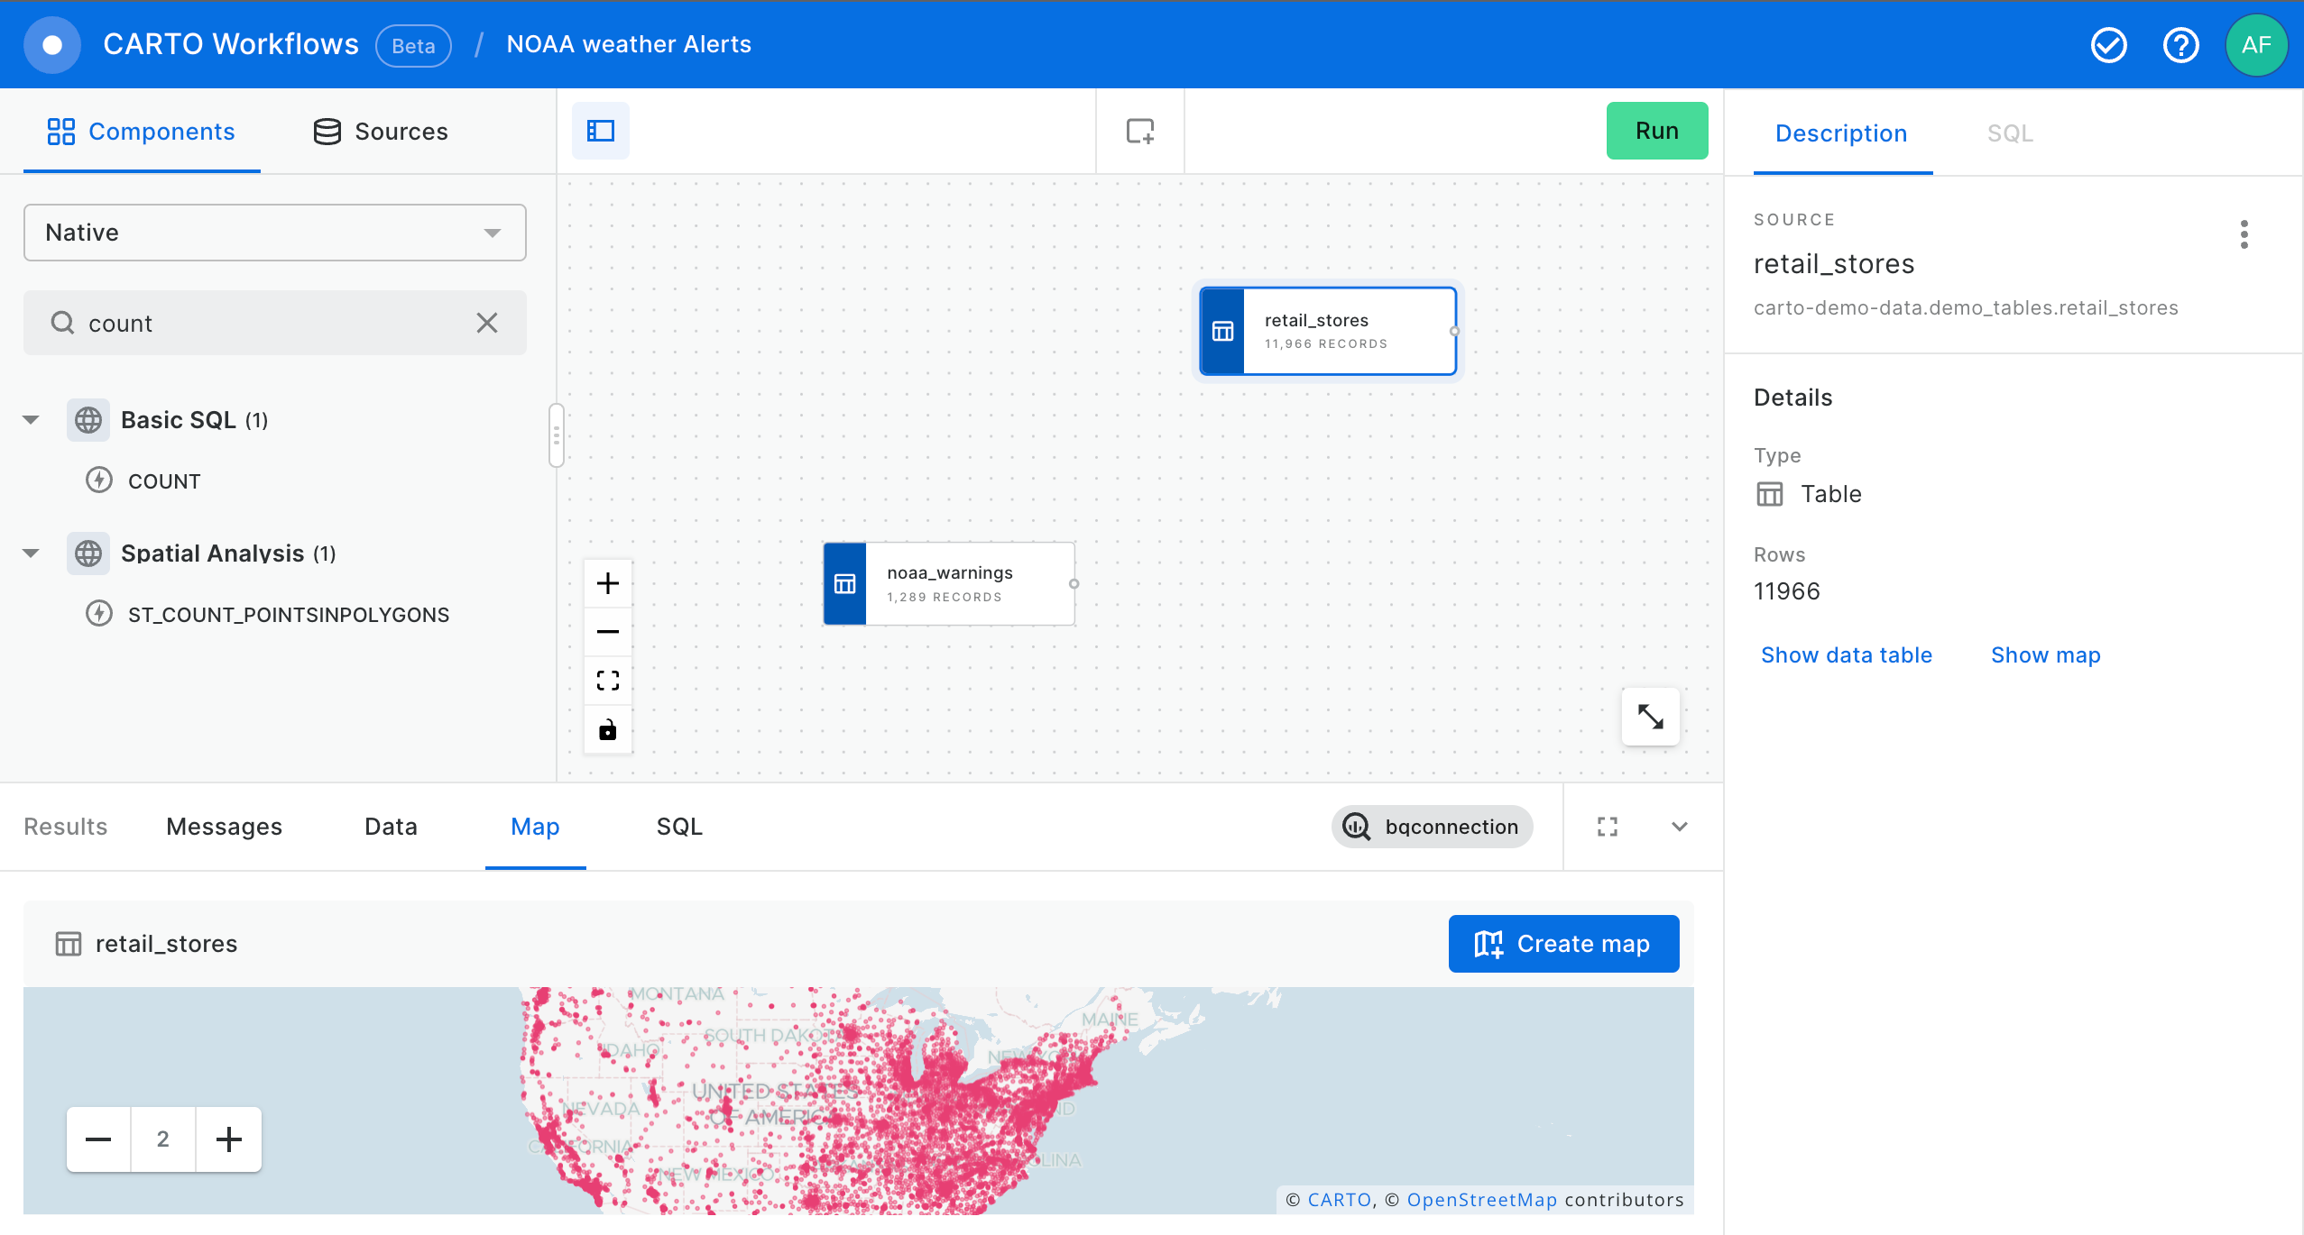
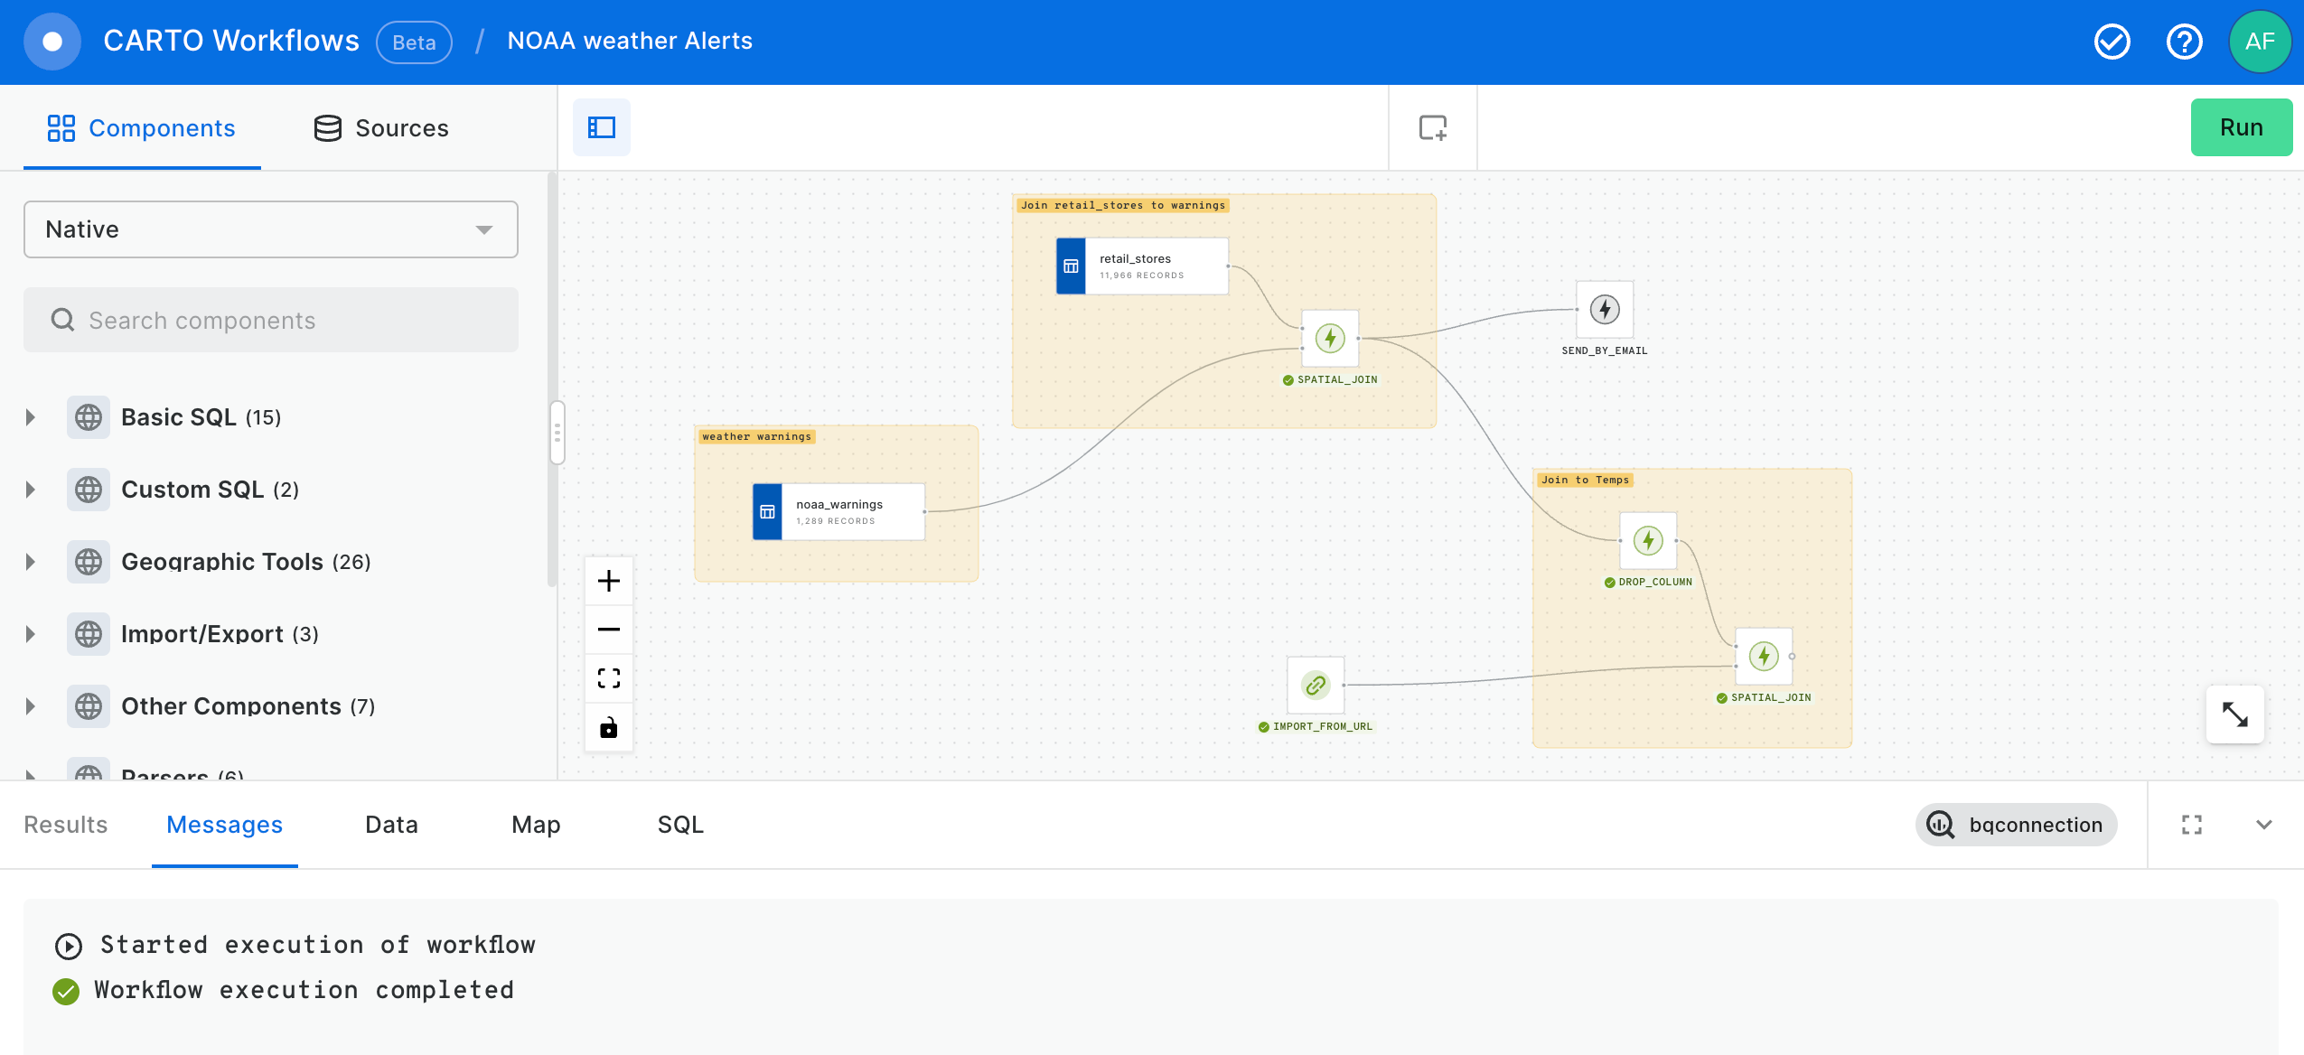
Now, let's add the noaa_warnings data table into our workflow from the demo_tables dataset available in the CARTO Data Warehouse connection.
After that, let’s add the retail_stores data table from the demo_tables dataset, also available in the CARTO Data Warehouse connection.
Now let's use the SPATIAL_JOIN component to know which of our retail_stores are in the warning areas.
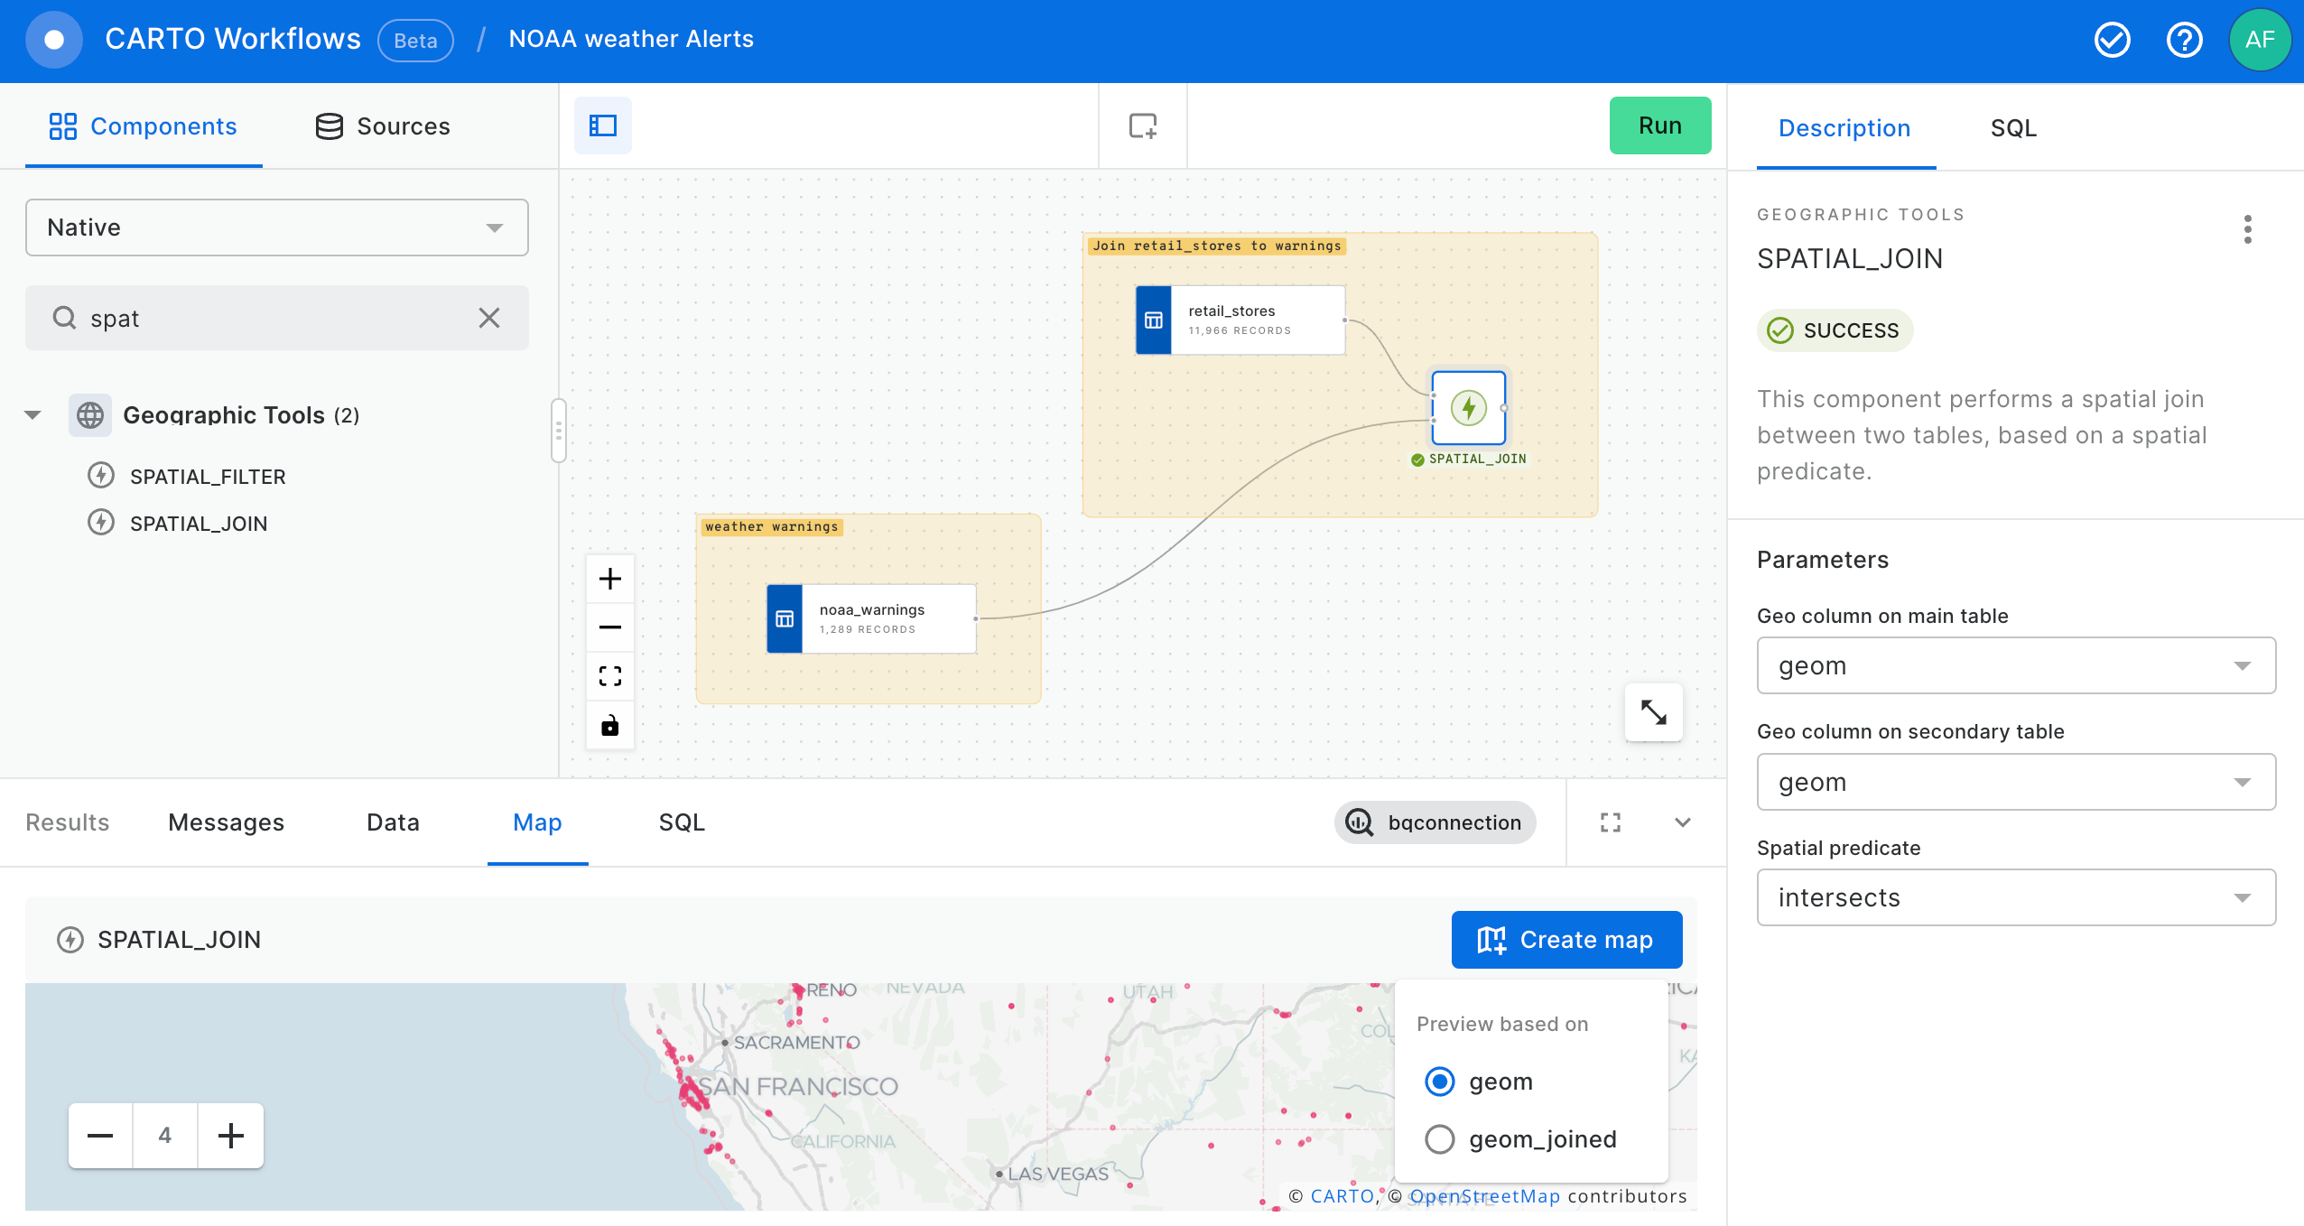
At that point we already have our stores within a NOAA Weather Warning and, if we deem it appropriate, we can send an email to share this warnings to anyone interested in this information using the SEND_BY_EMAIL component.
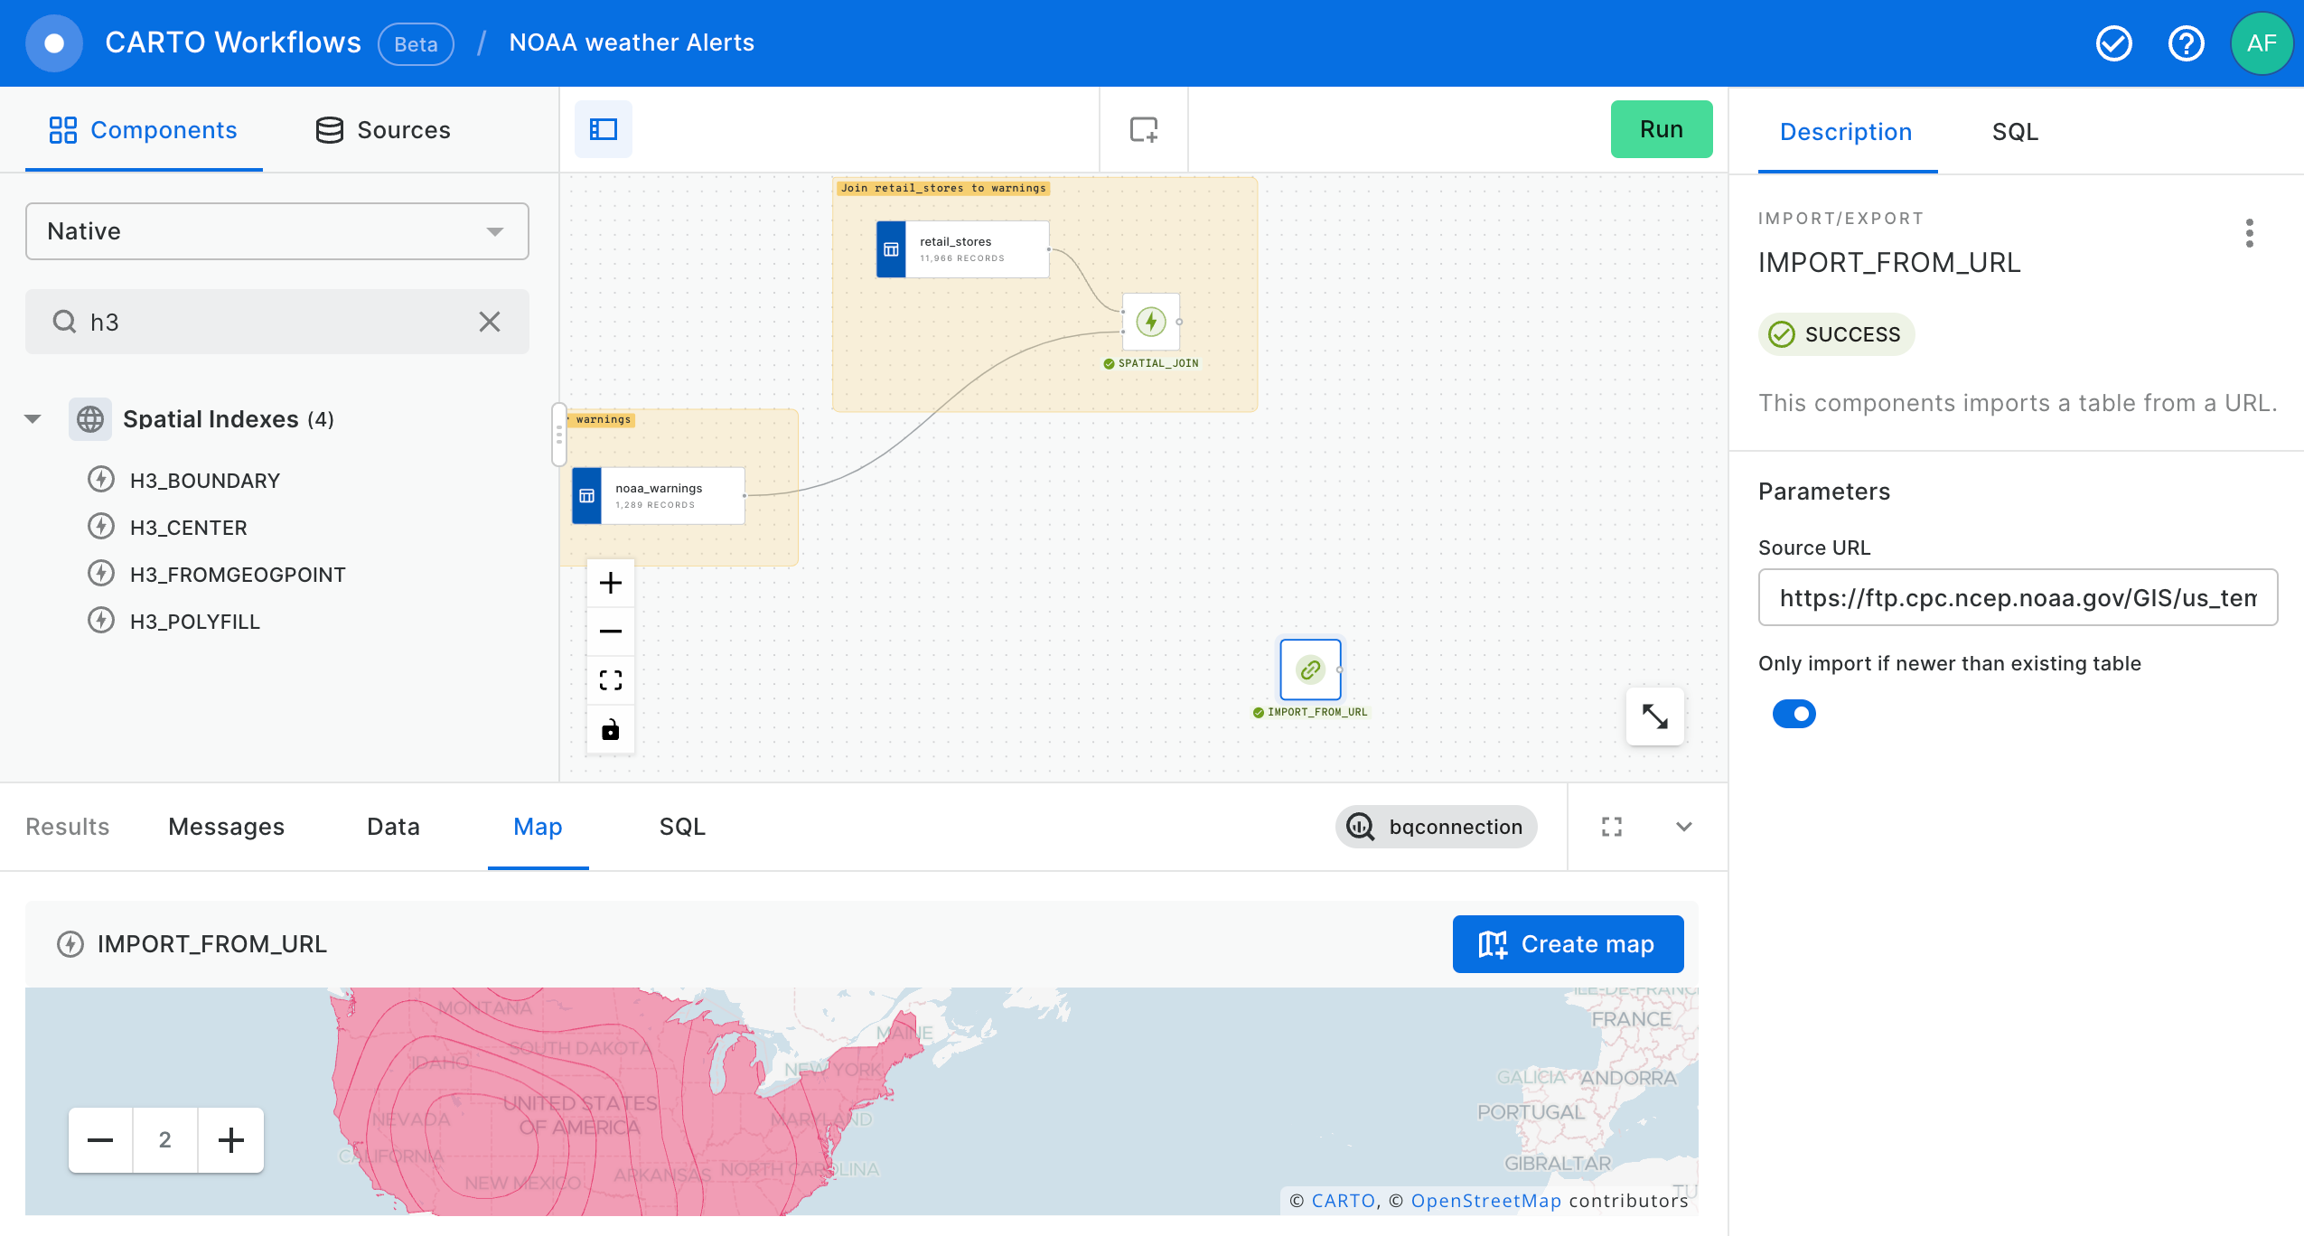
After that, we can use the IMPORT_FROM_URL component to import the temperature forecast from Climate Prediction Center using this URL in particular to take the latest temperature forecast in a Shapefile: https://ftp.cpc.ncep.noaa.gov/GIS/us_tempprcpfcst/610temp_latest.zip. These data will be consulted again with each execution of the workflow. It means that the results of the workflow will change if the data has been updated.
Now, we are going to drop the geom_joined column to keep only one geom column in order to avoid confusions.
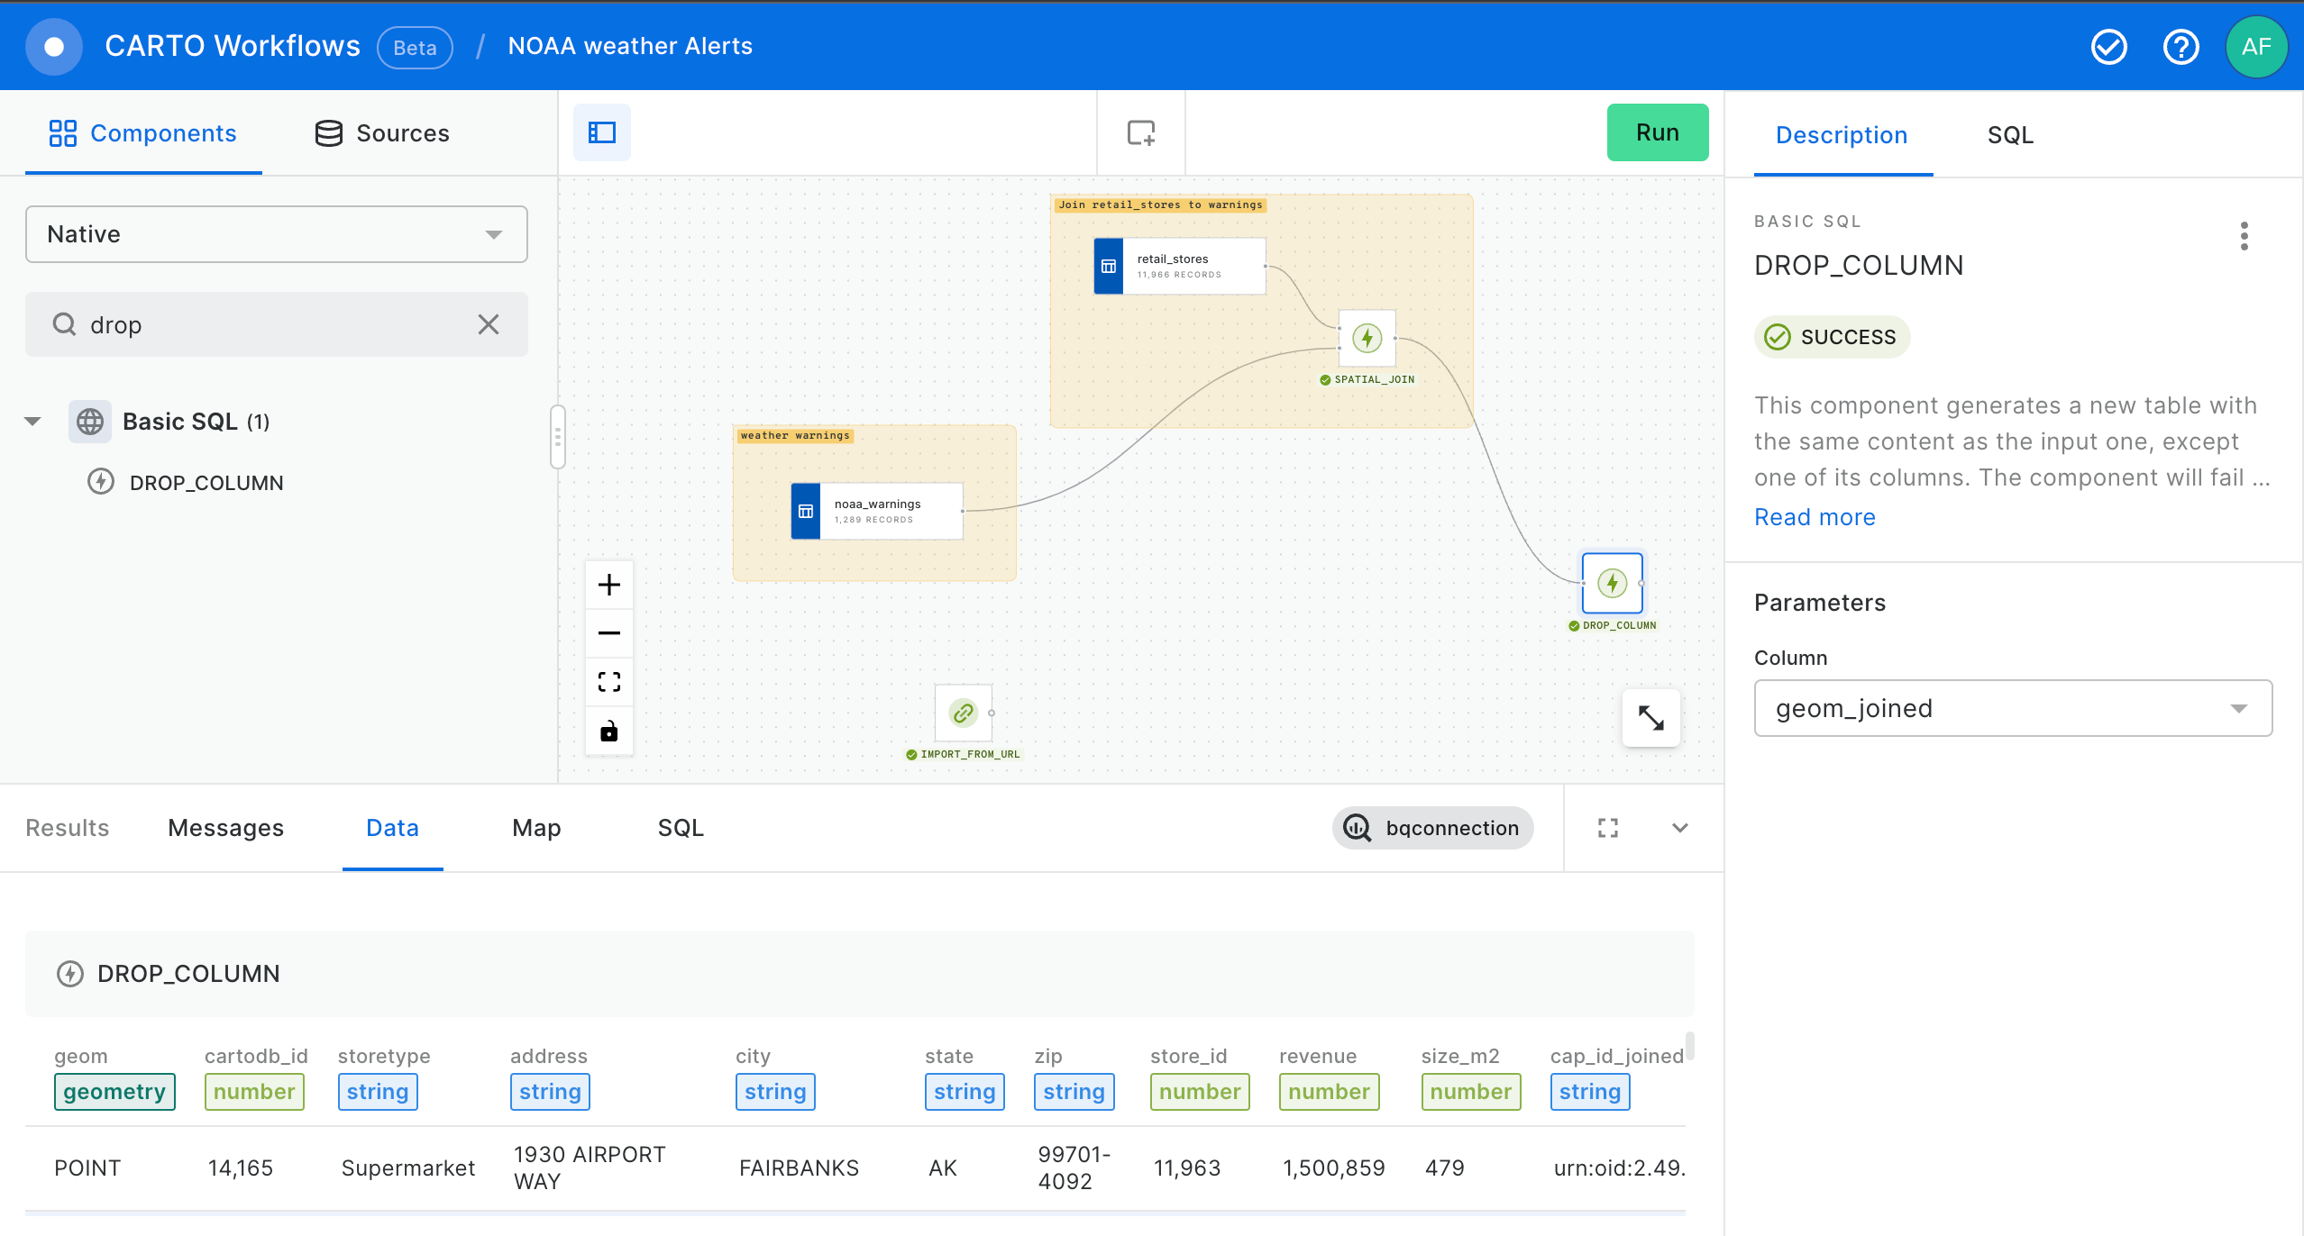
We will proceed to make a new SPATIAL_JOIN in order to have the temperature forecast associated to the stores.
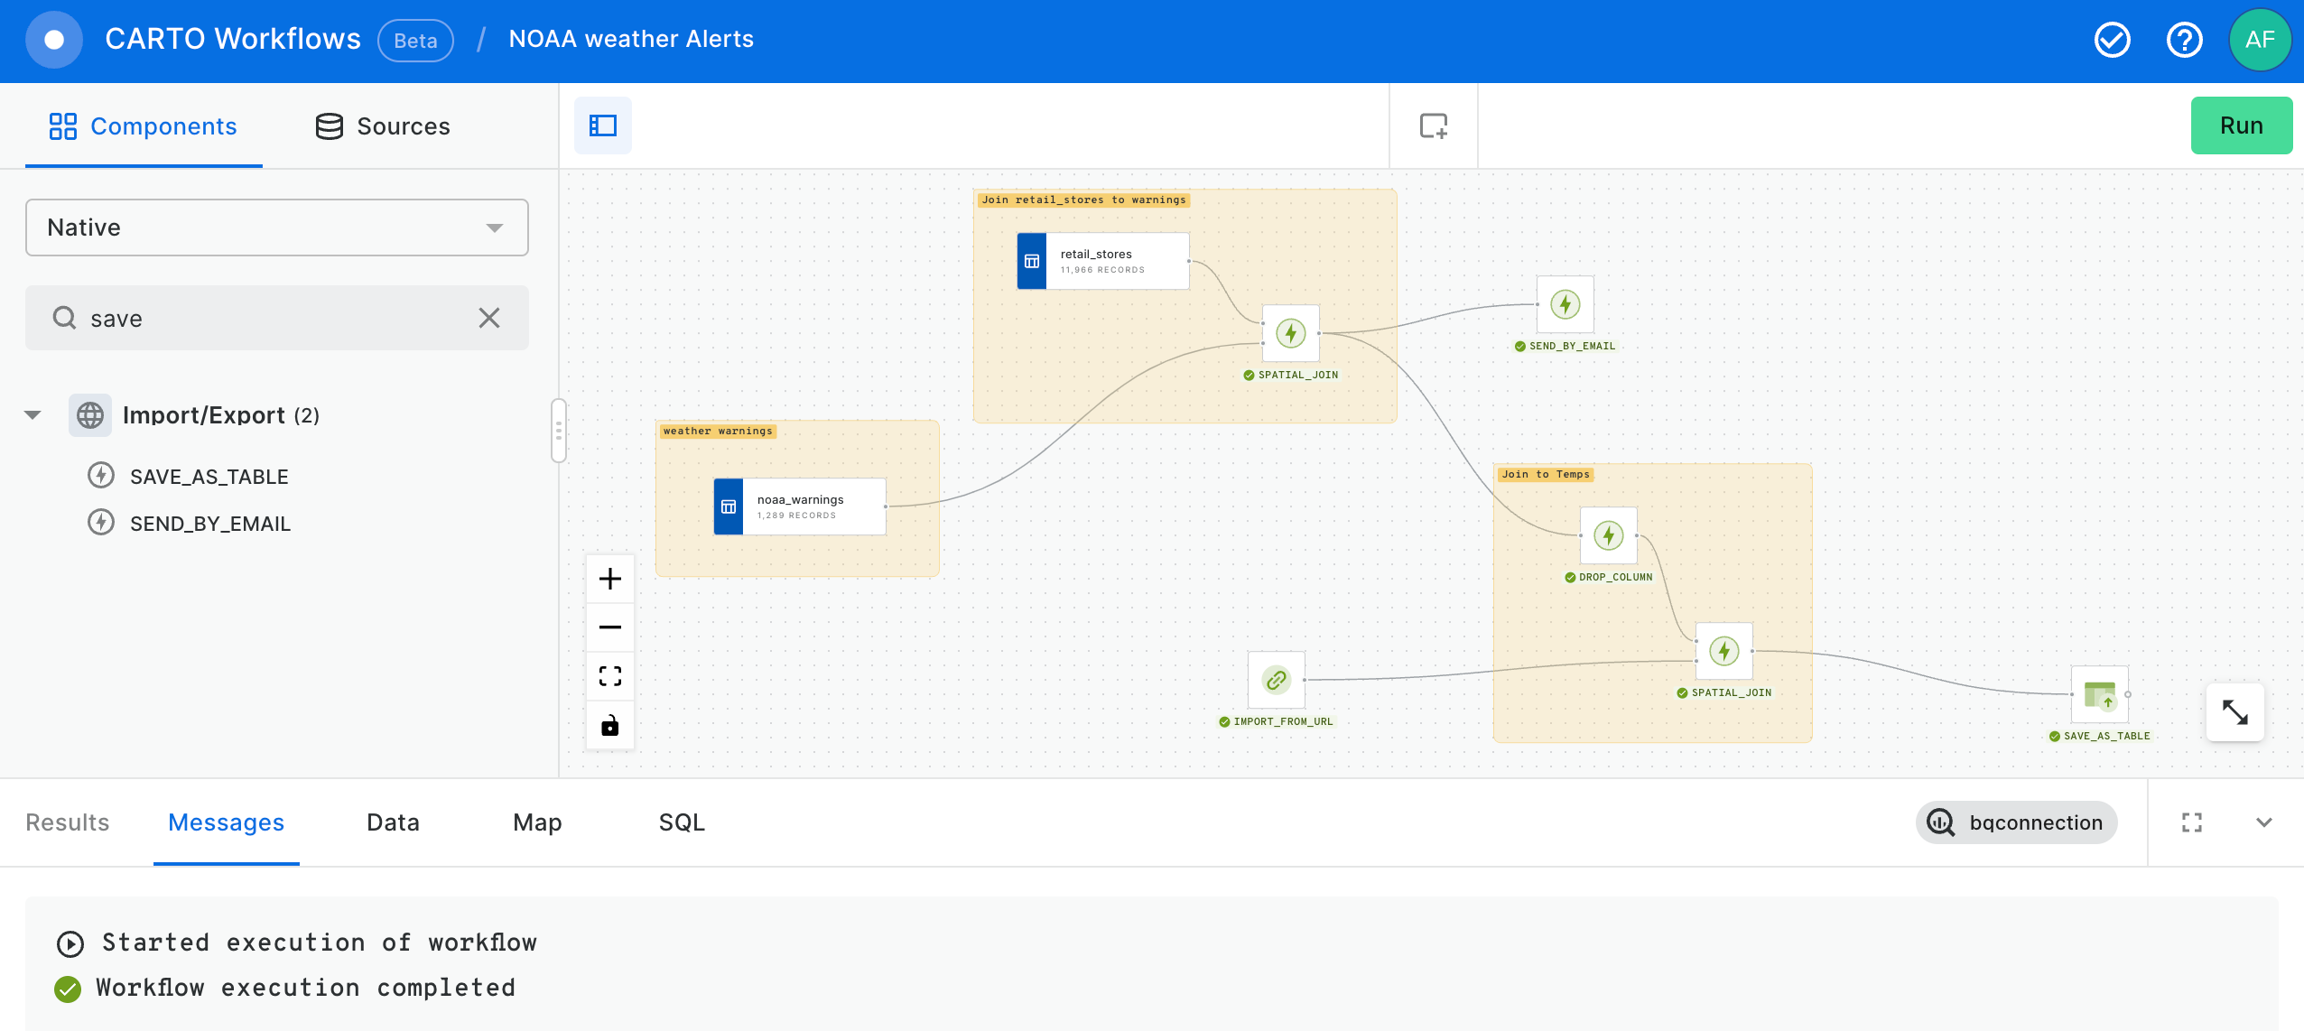
Finally, we conclude with this example saving the outcome in a new table using SAVE_AS_TABLE component. Remember that you should specify the fully qualified name of the new dataset in the field of this component.
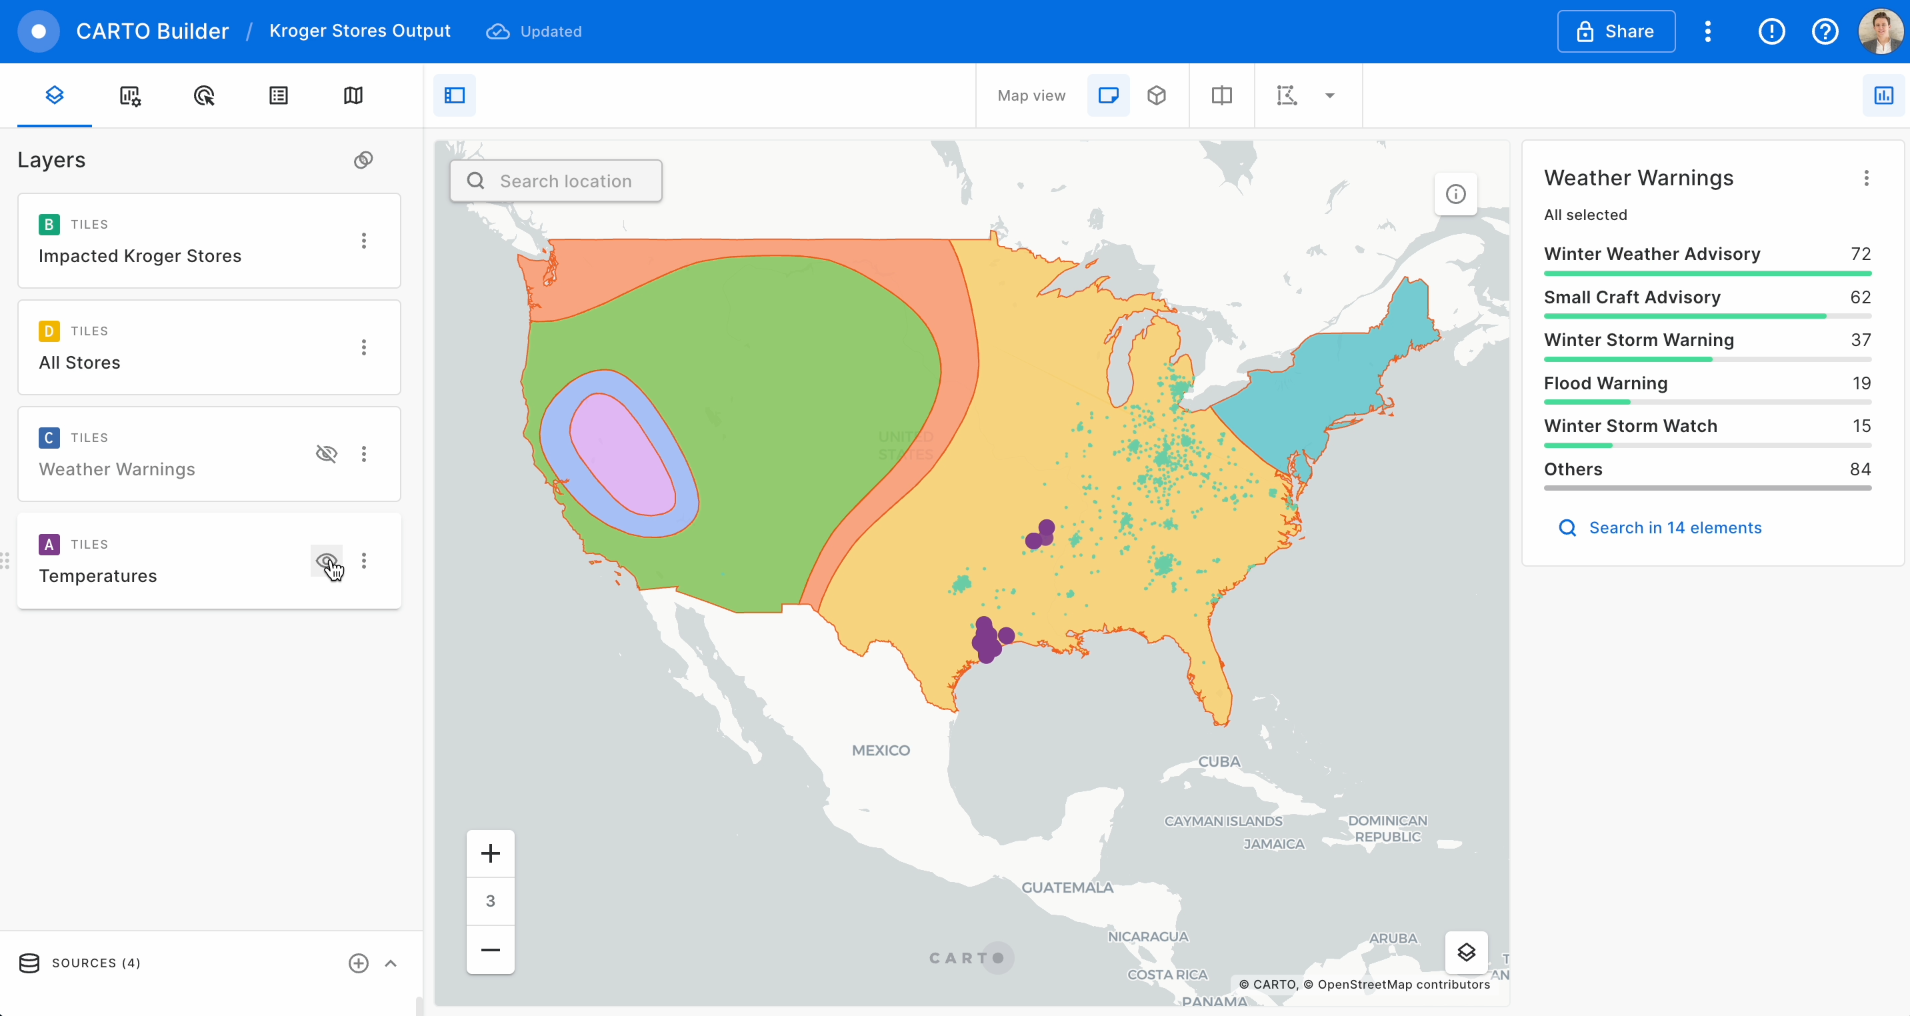
We can use the "Create map" button in the map section of the Results panel to create a new Builder map and analyze the results in a map.
Last updated
Was this helpful?

