A Quadkey grid of stores locations and simple cannibalization analysis

Requirements
To run this example you'll need:
The latest version of the Analytics Toolbox Core Native App installed in your Snowflake database
Optional: An active CARTO organization to visualize the results in a map
Example
Building the Quadkey grid
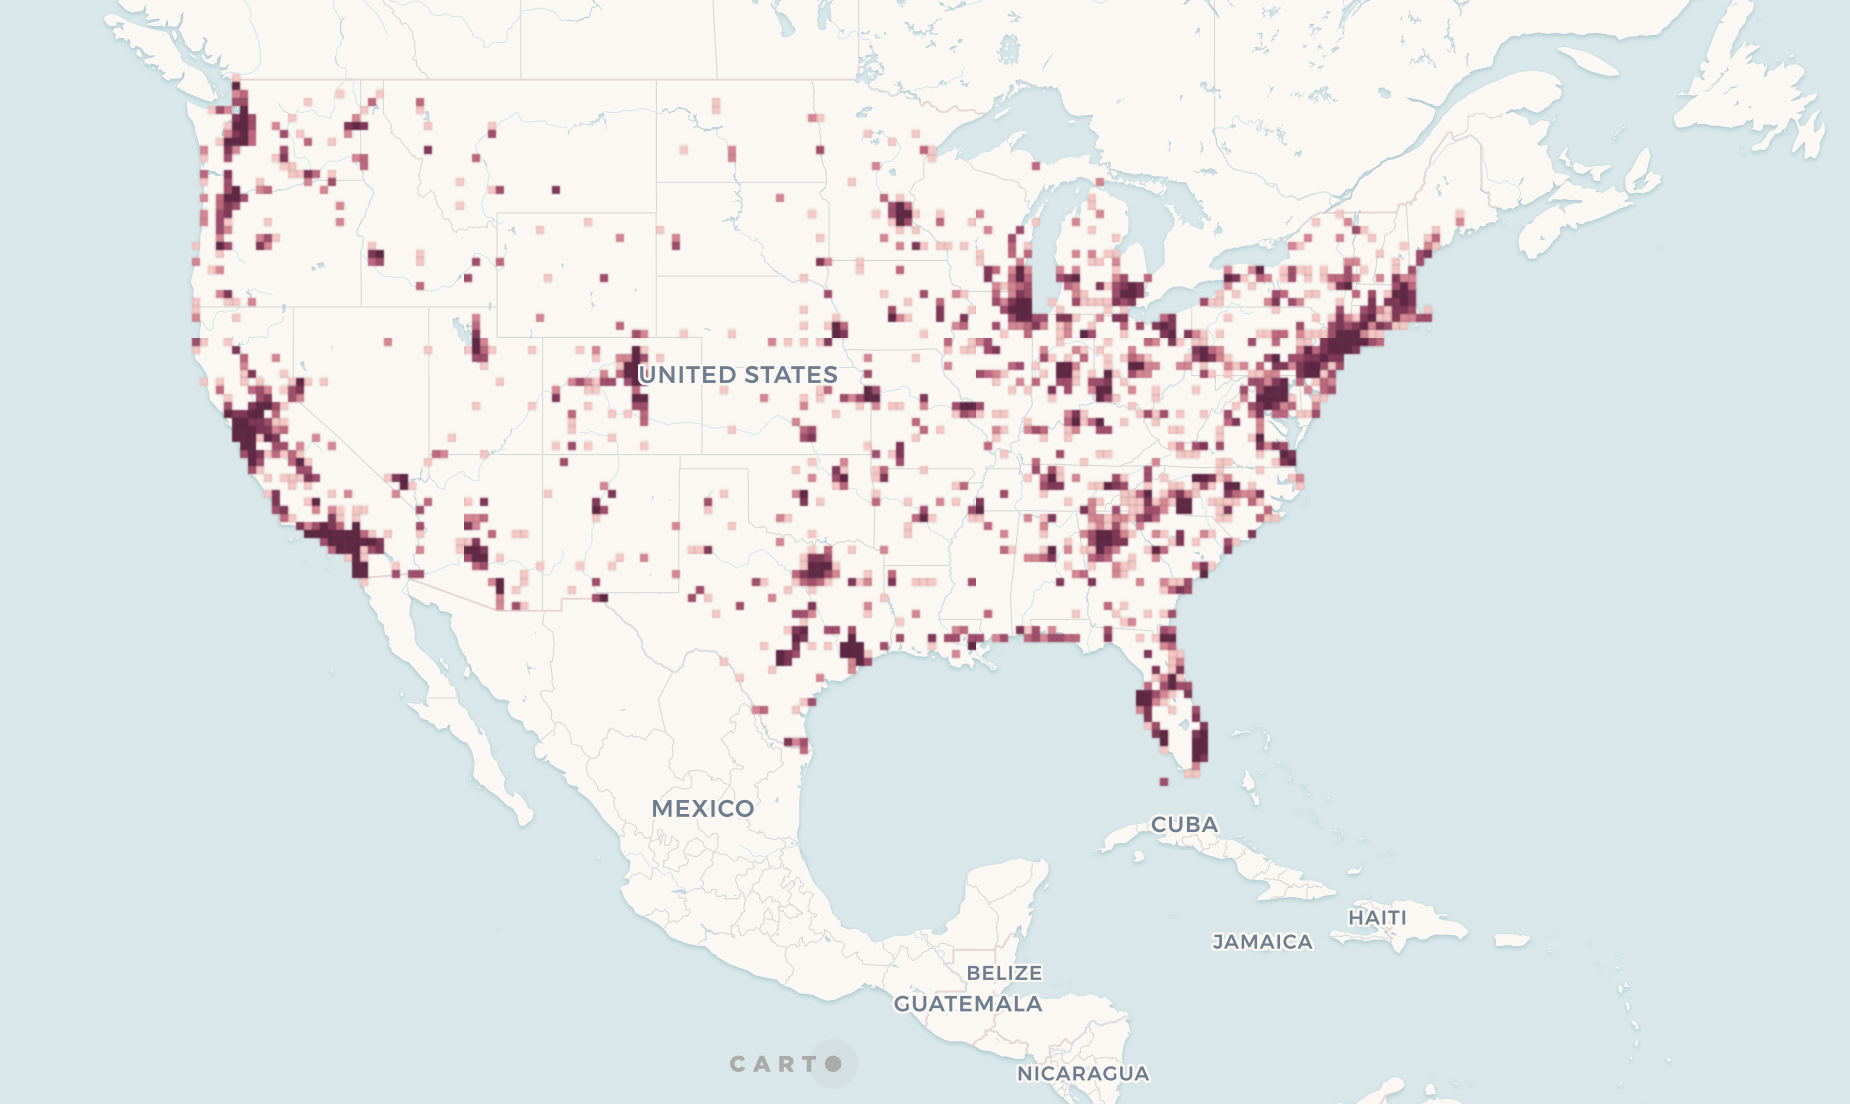
We are going to demonstrate how fast and easy it is to make a visualization of a Quadkey grid to identify the concentration of Starbucks locations in the US. With a single query, we are going to calculate how many Starbucks locations fall within each quadkey grid cell of resolution 10.
This query adds two new columns to our dataset: geom, representing the boundary of each of the Quadkey grid cells where there’s at least one Starbucks, and agg_total, containing the total number of locations that fall within each cell. Finally, we can visualize the result.

Using finer resolution Quadkeys for simple cannibalization analysis
Next, we will analyze in finer detail the grid cells in Las Vegas to identify potential cannibalizations through to analysis of the surroundings of each store. We present the same analysis applying two different methods, which simply differ in the way the influence areas around each store are defined.
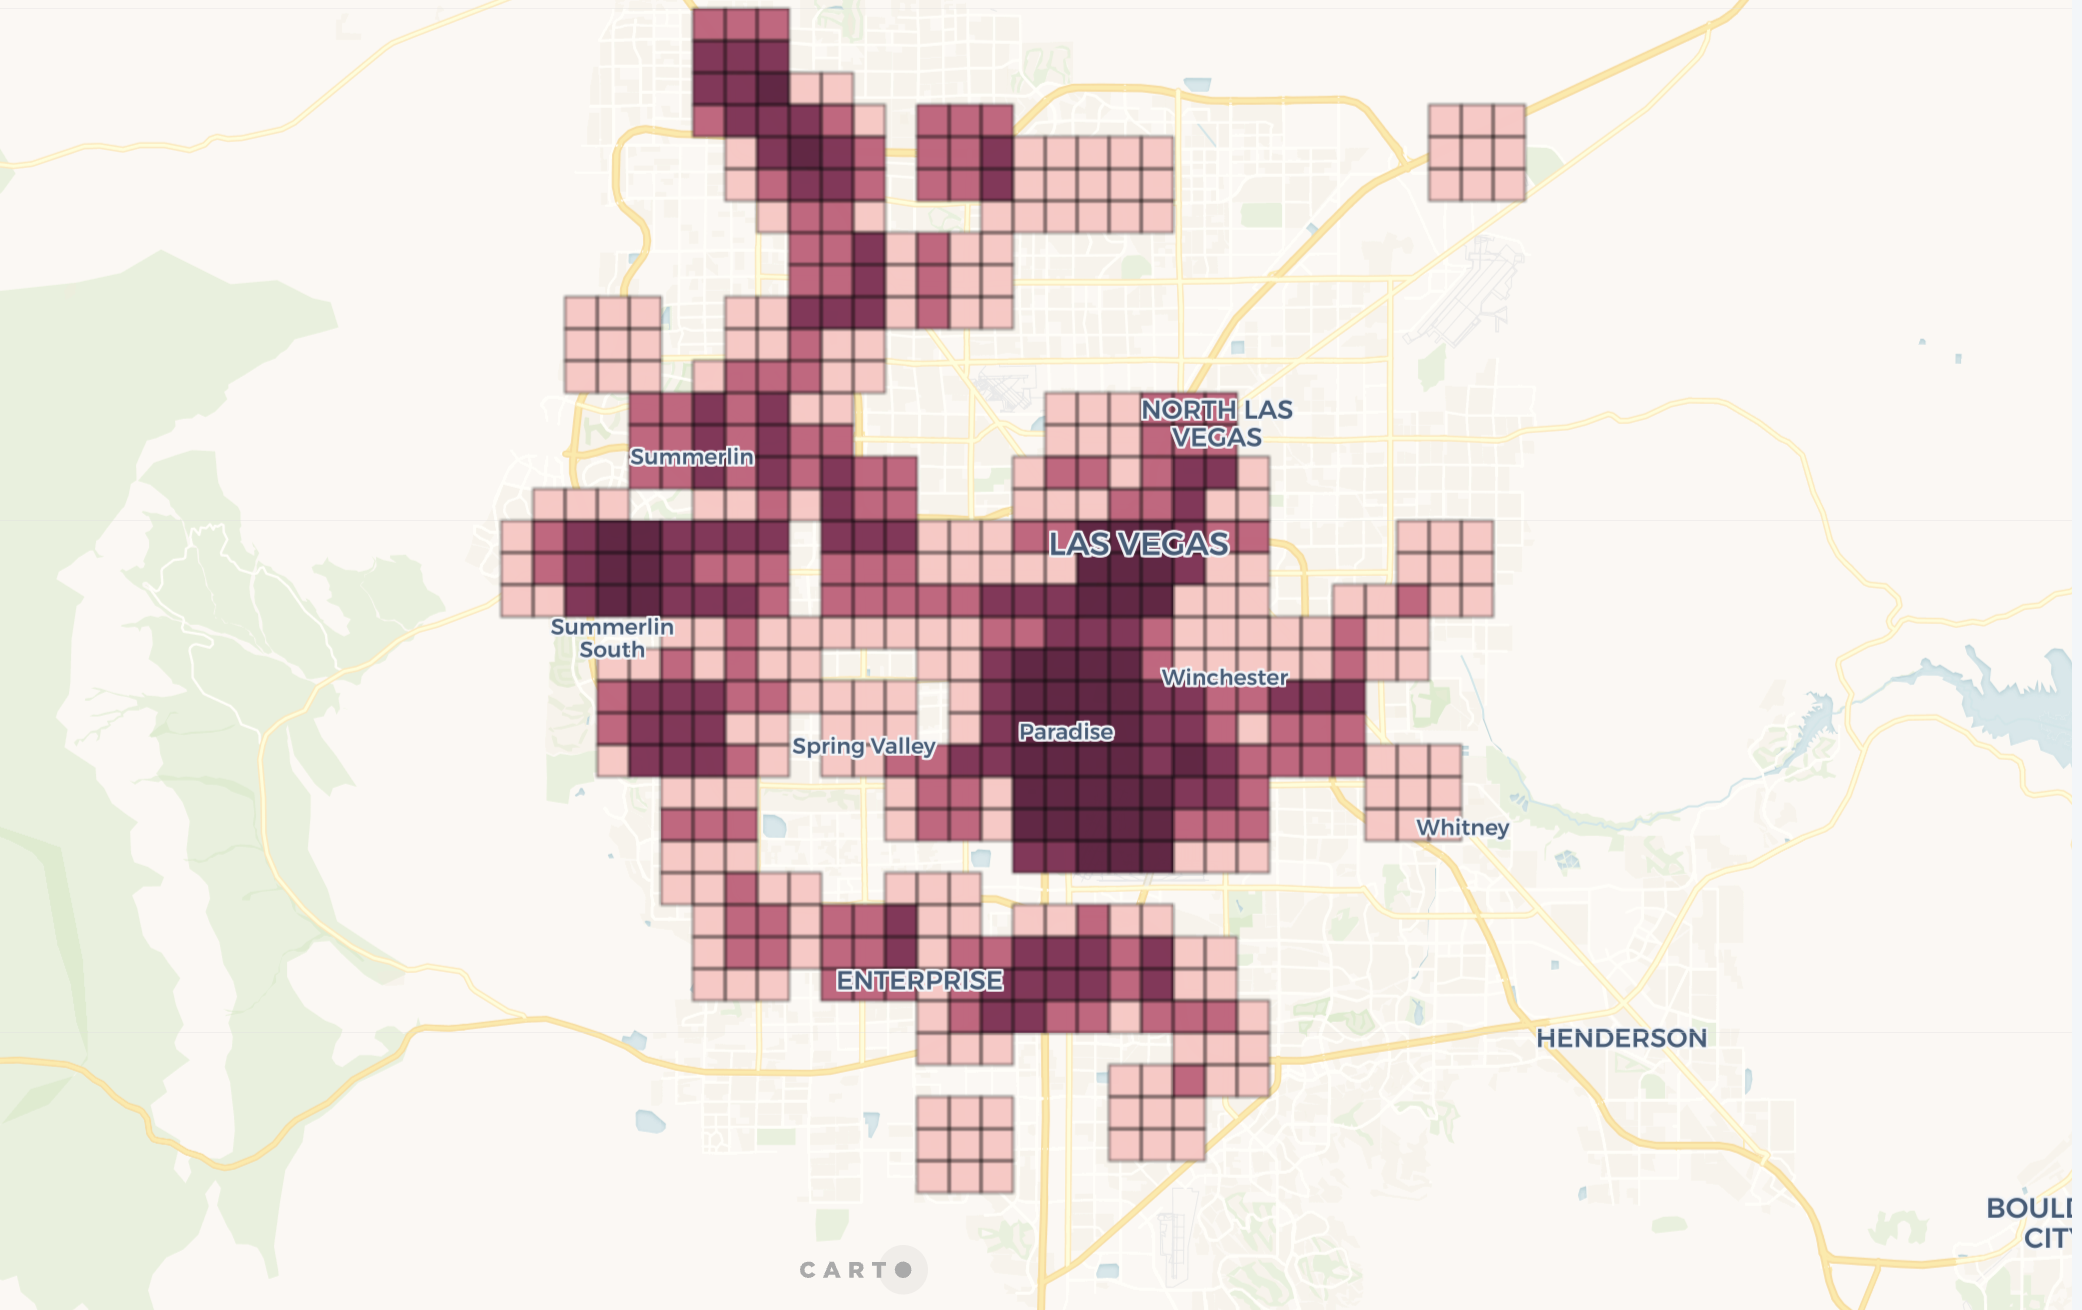
The first method uses the QUADBIN_KRING function with distance 1 to define an area of influence around each store, and then aggregates the quadkey indexes around each Starbucks location.
Visualizing the results we can clearly identify the areas in Las Vegas that are overserved by Starbucks, represented by the darkest colours.

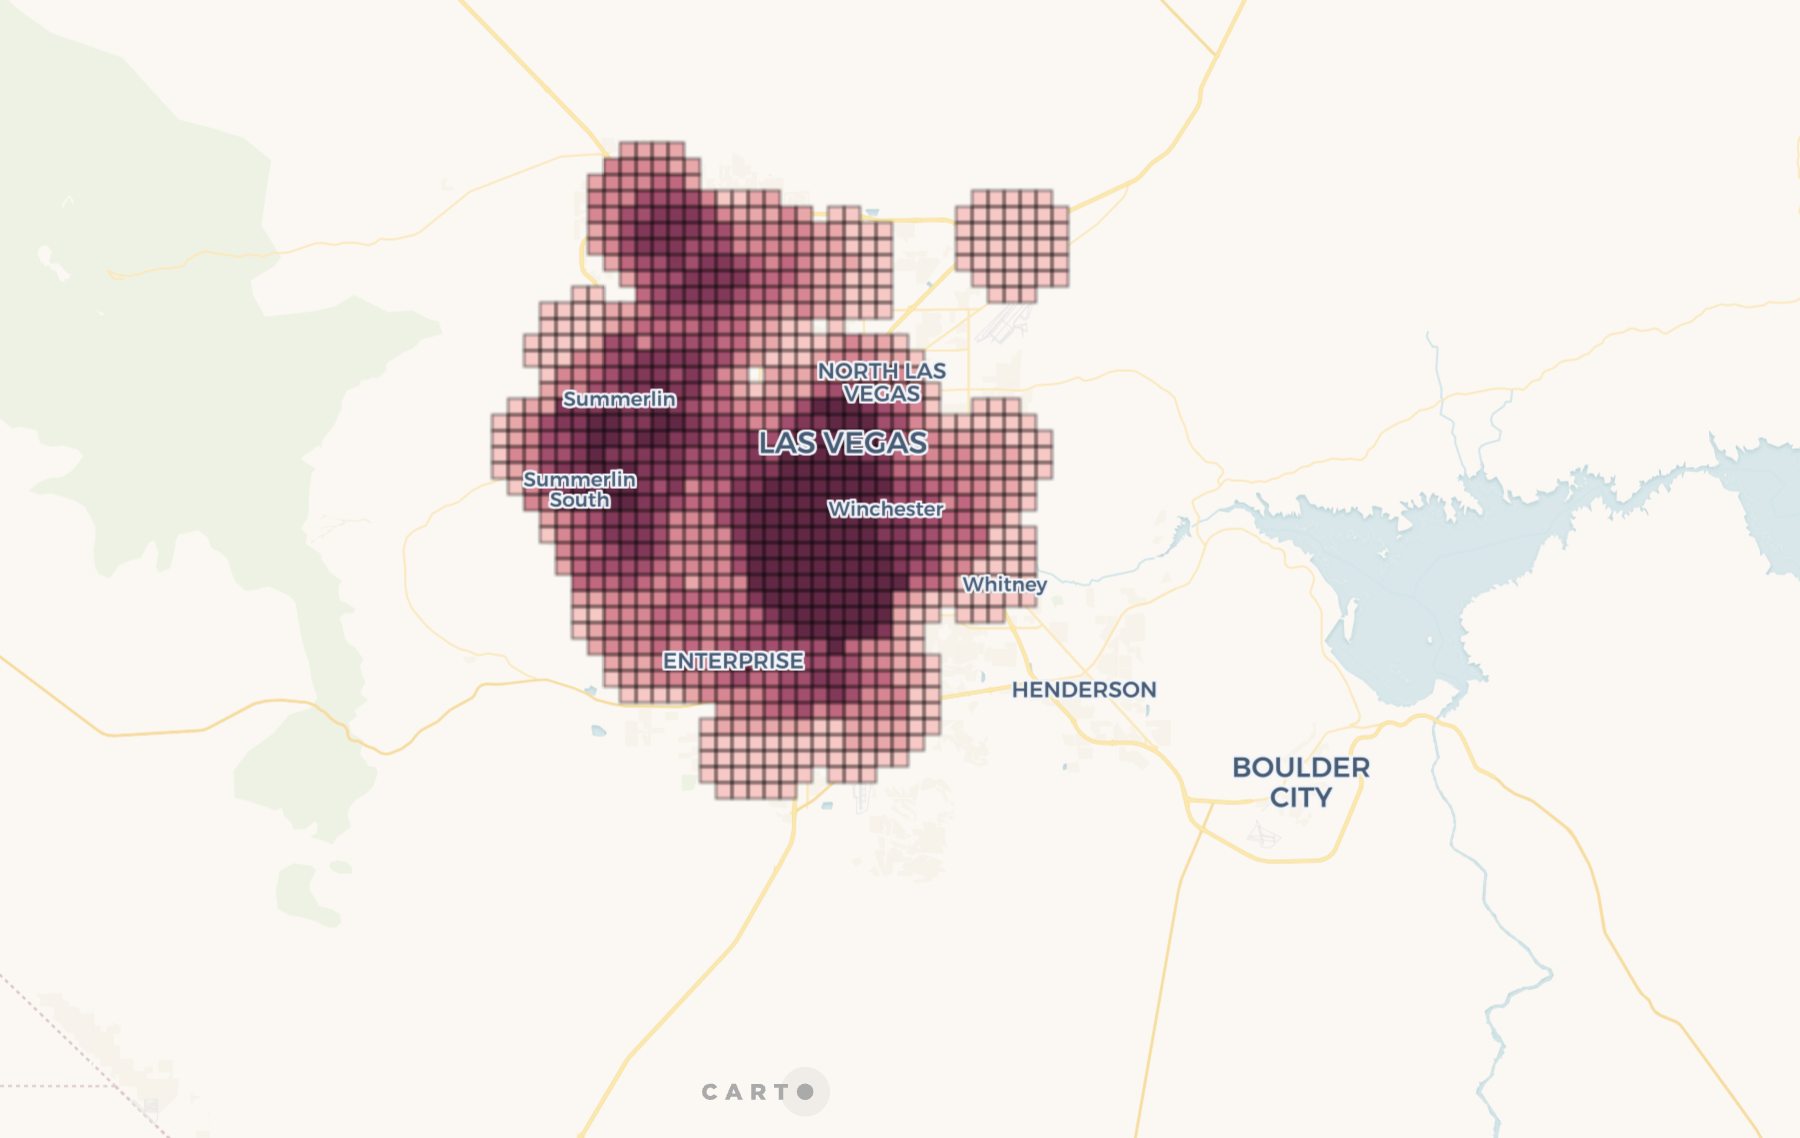
The second approach calculates how many Starbucks fall within a radius of three kilometers around each location. We first use the function ST_MAKEELLIPSE to generate the buffer around each point. Notice that we are reducing the number of default steps used to calculate these buffers, as it will not cause major differences in the result but it greatly improves performance.
Darkest areas on the map are those with the higher coverage by Starbucks.

Last updated
Was this helpful?

