Data enrichment using the Data Observatory

Requirements
To run this example you'll need:
An active CARTO organization
The latest version of the Analytics Toolbox Advanced installed in your Snowflake database
Prefer a low-code approach? Check out our Workflows templates for Data Enrichment.
Guide
In this guide you will learn how to perform data enrichment using Data Observatory data and the Analytics Toolbox. In this guide you will learn how to perform data enrichment using Data Observatory data and the Analytics Toolbox from your Snowflake console. To use the Enrichment UI available in the Data Explorer, please refer to this guide.
1. Create a connection with Snowflake in the CARTO Workspace
Sign into your CARTO Workspace. If you still don’t have an account, you can sign-up here for a 14-day trial.
Navigate to the Connections section.
Create a new connection with Snowflake.
For more details, please refer to the documentation.
2. Subscribe to the Data Observatory datasets
Navigate to the Data Observatory section of the CARTO Workspace.
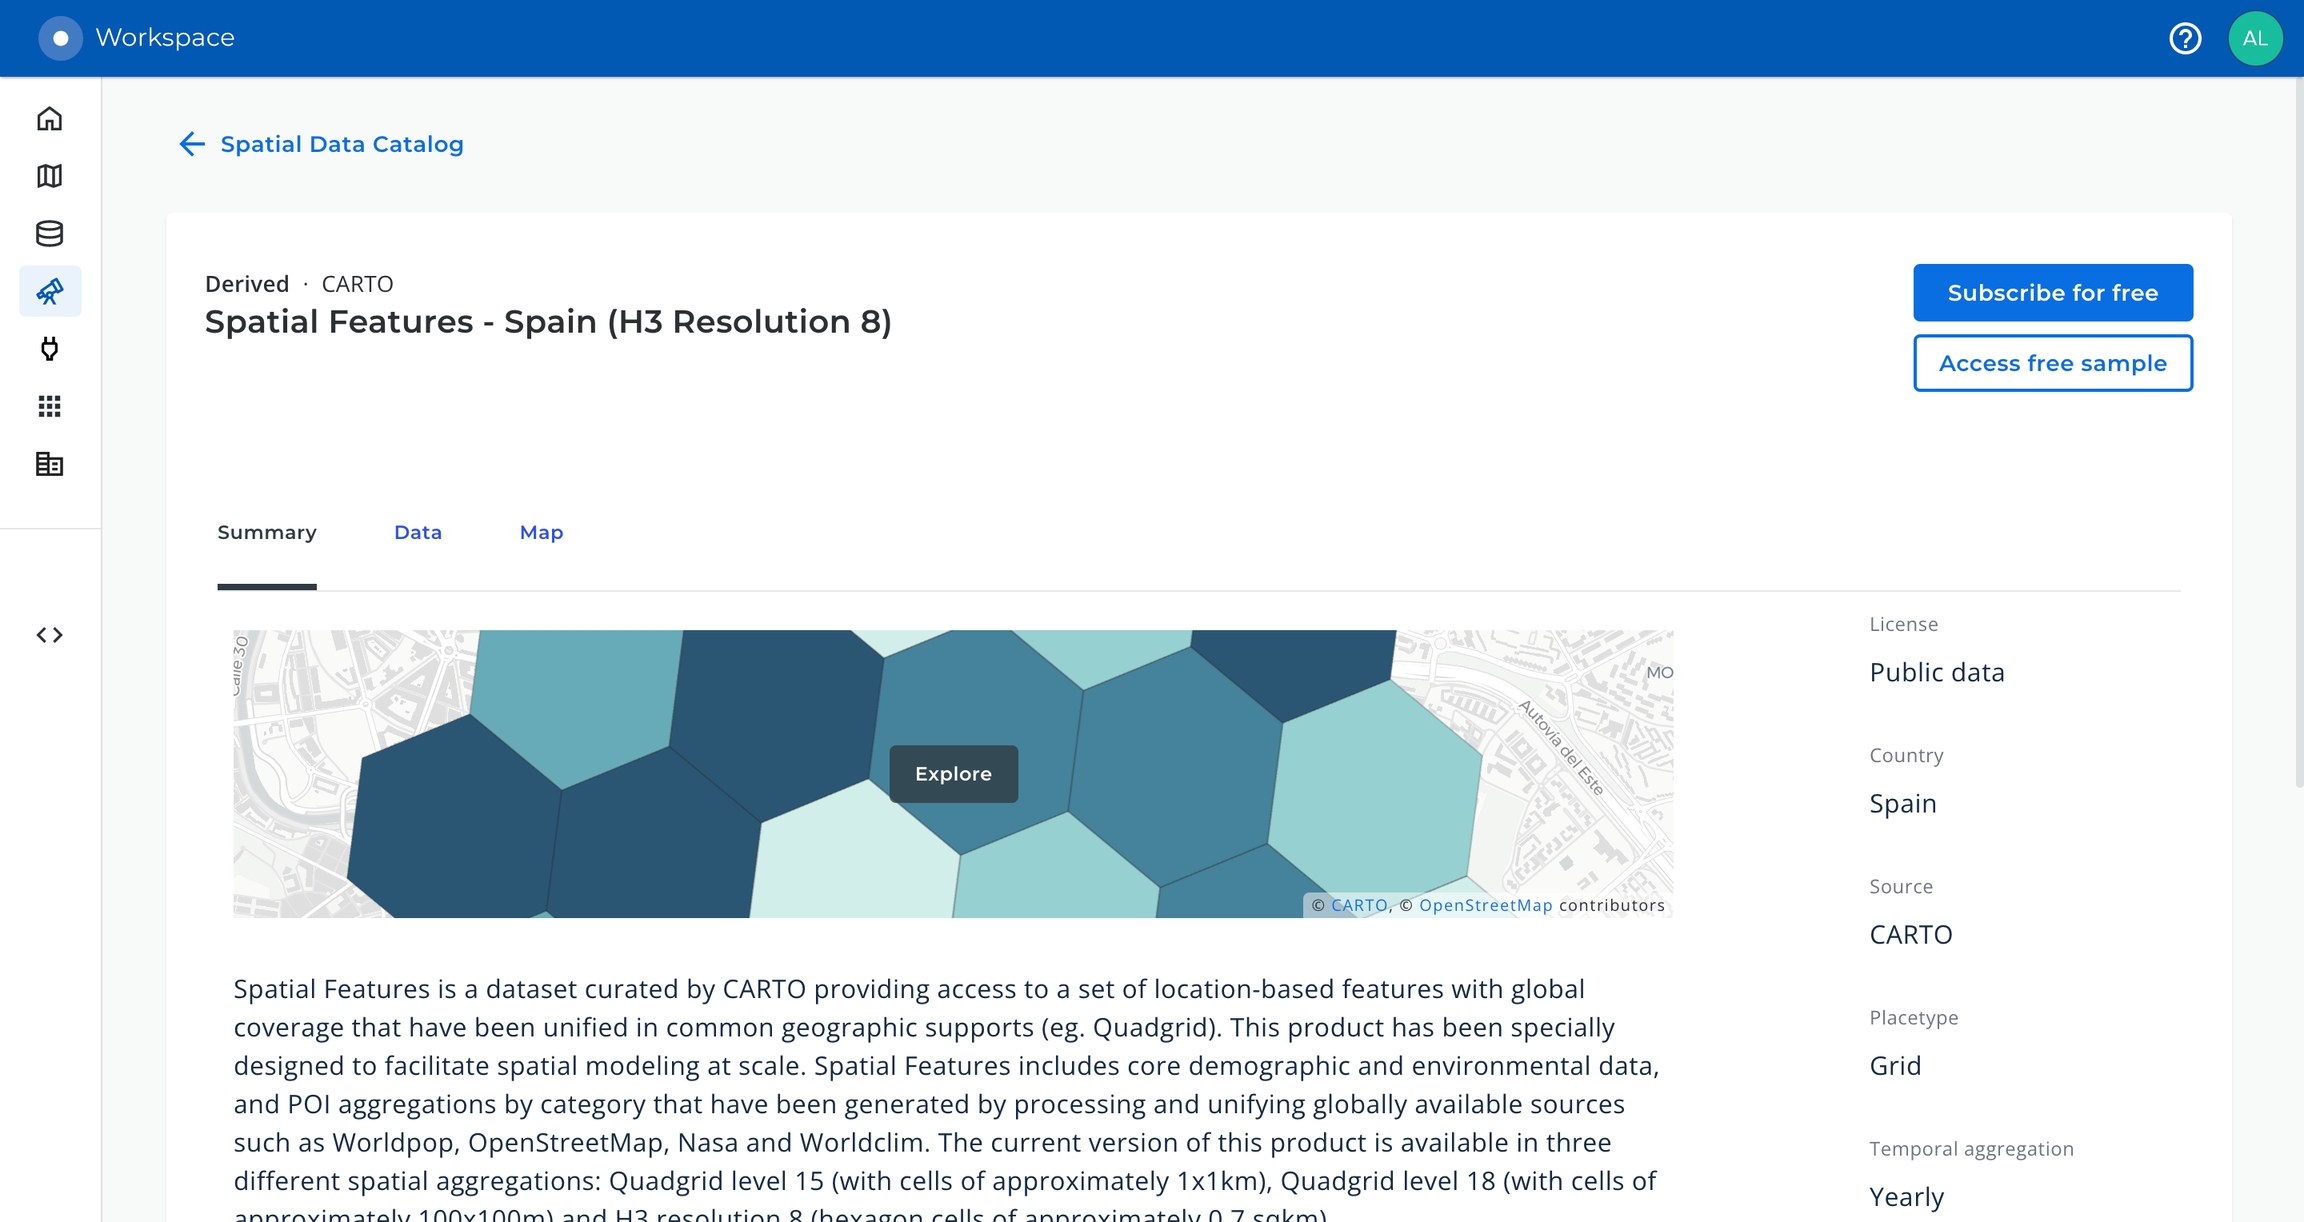
Using the Spatial Data Catalog, subscribe to the following datasets. You can find these datasets by using the search bar or the filter column on the left of the screen:
Spatial Features - Spain (H3 Resolution 8) from CARTO.
Census Sections (Spain), with displaced Canary Islands (2020) from CARTO.

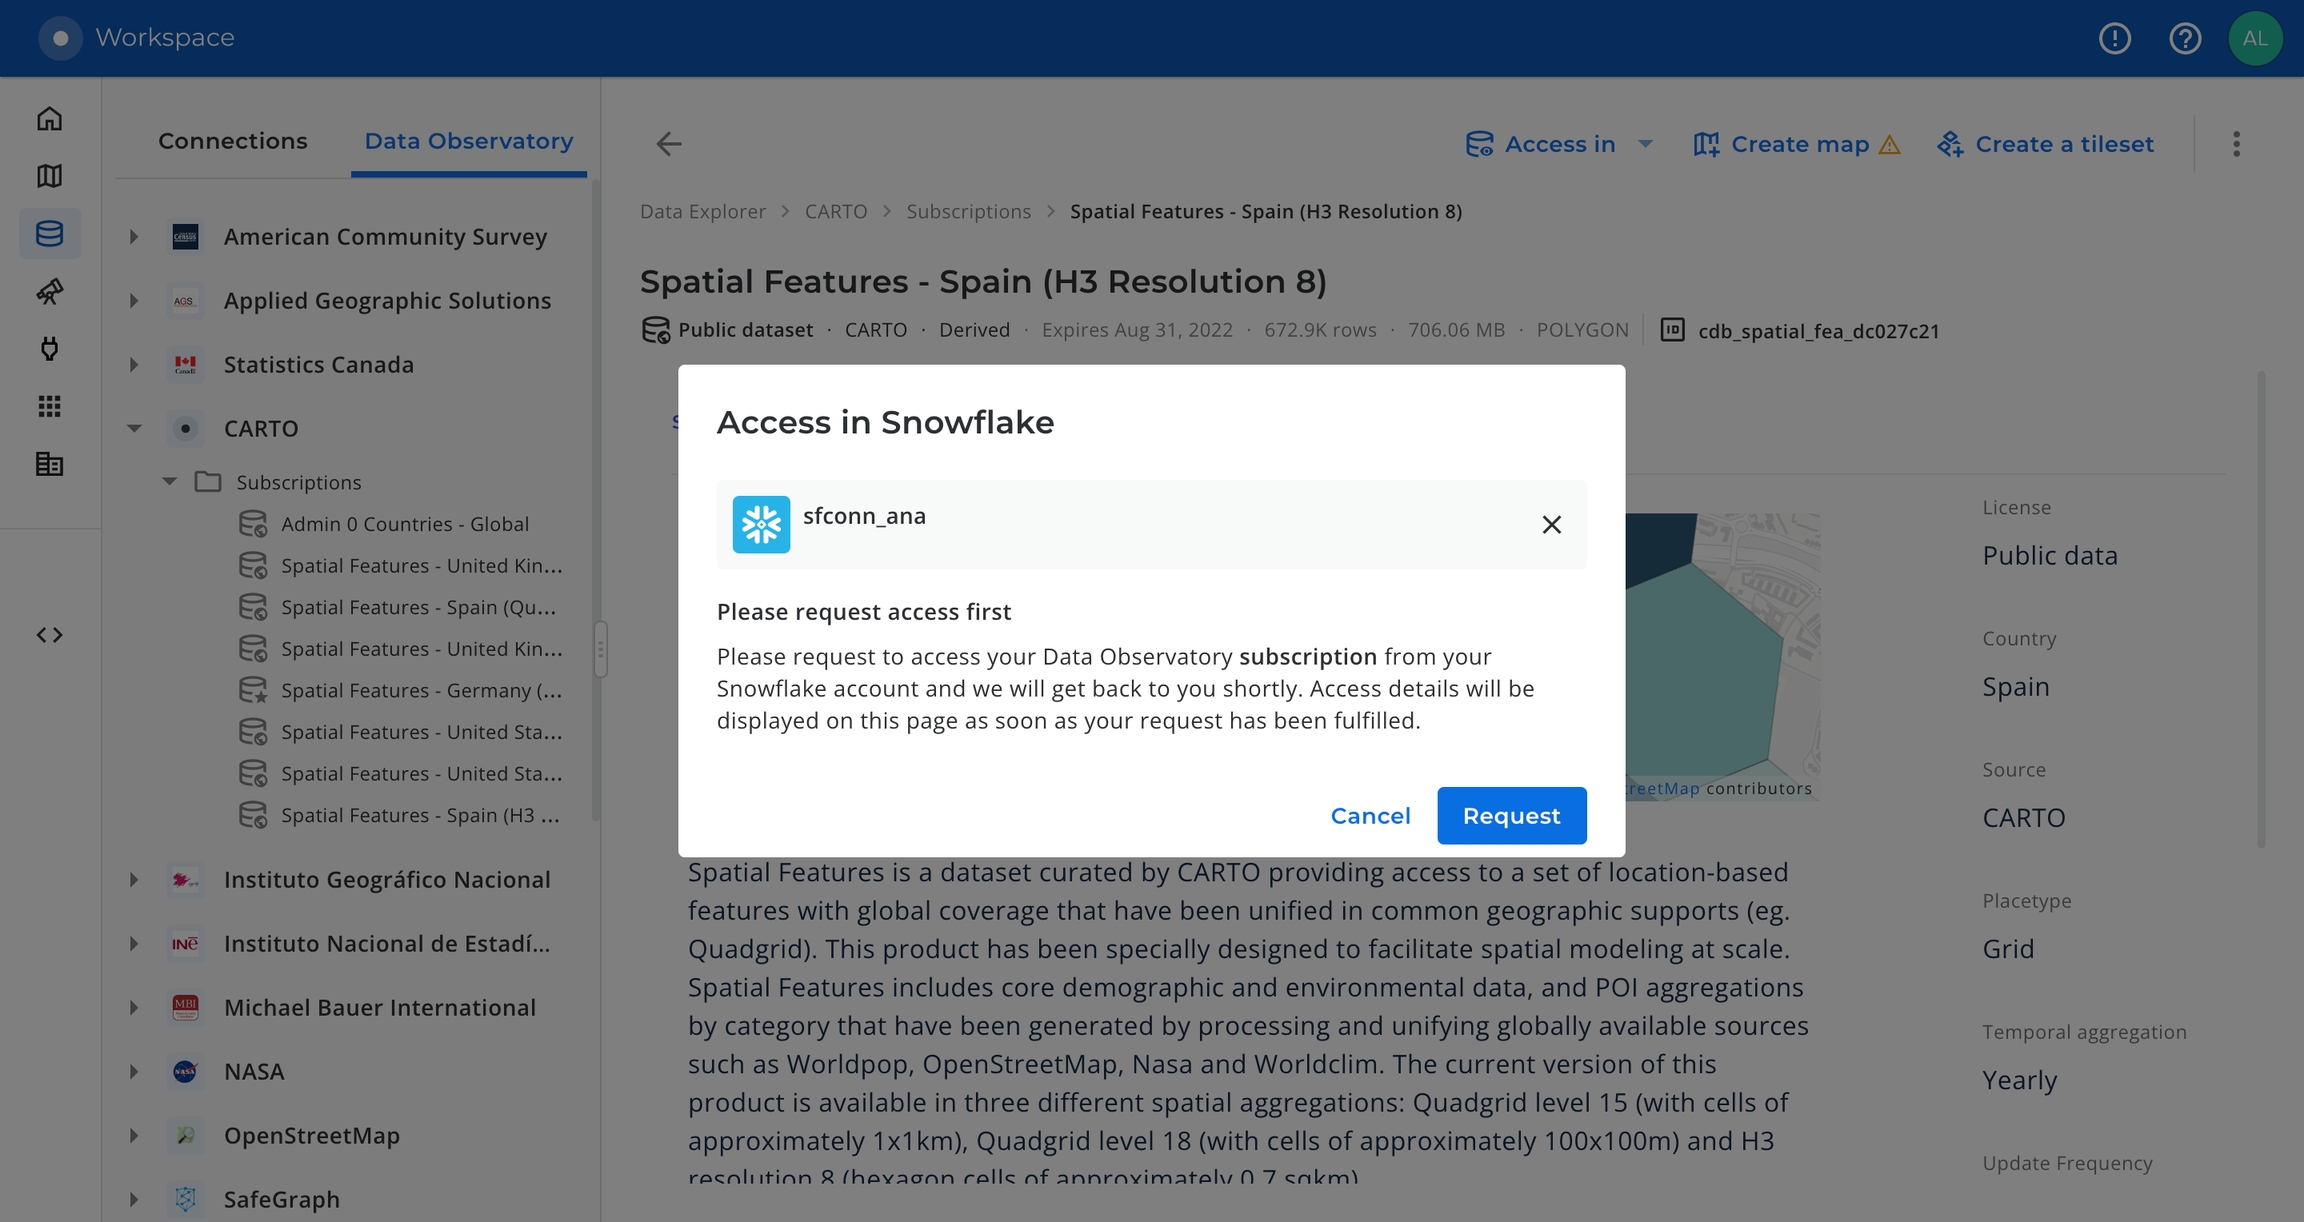
In order for you to access any of your Data Observatory subscriptions from Snowflake, our team need to manually provision the data in a database within your Snowflake account. Go to the “Access In > Snowflake” of at least one of your Data Observatory subscriptions and place a request so our engineering team start the provisioning process.

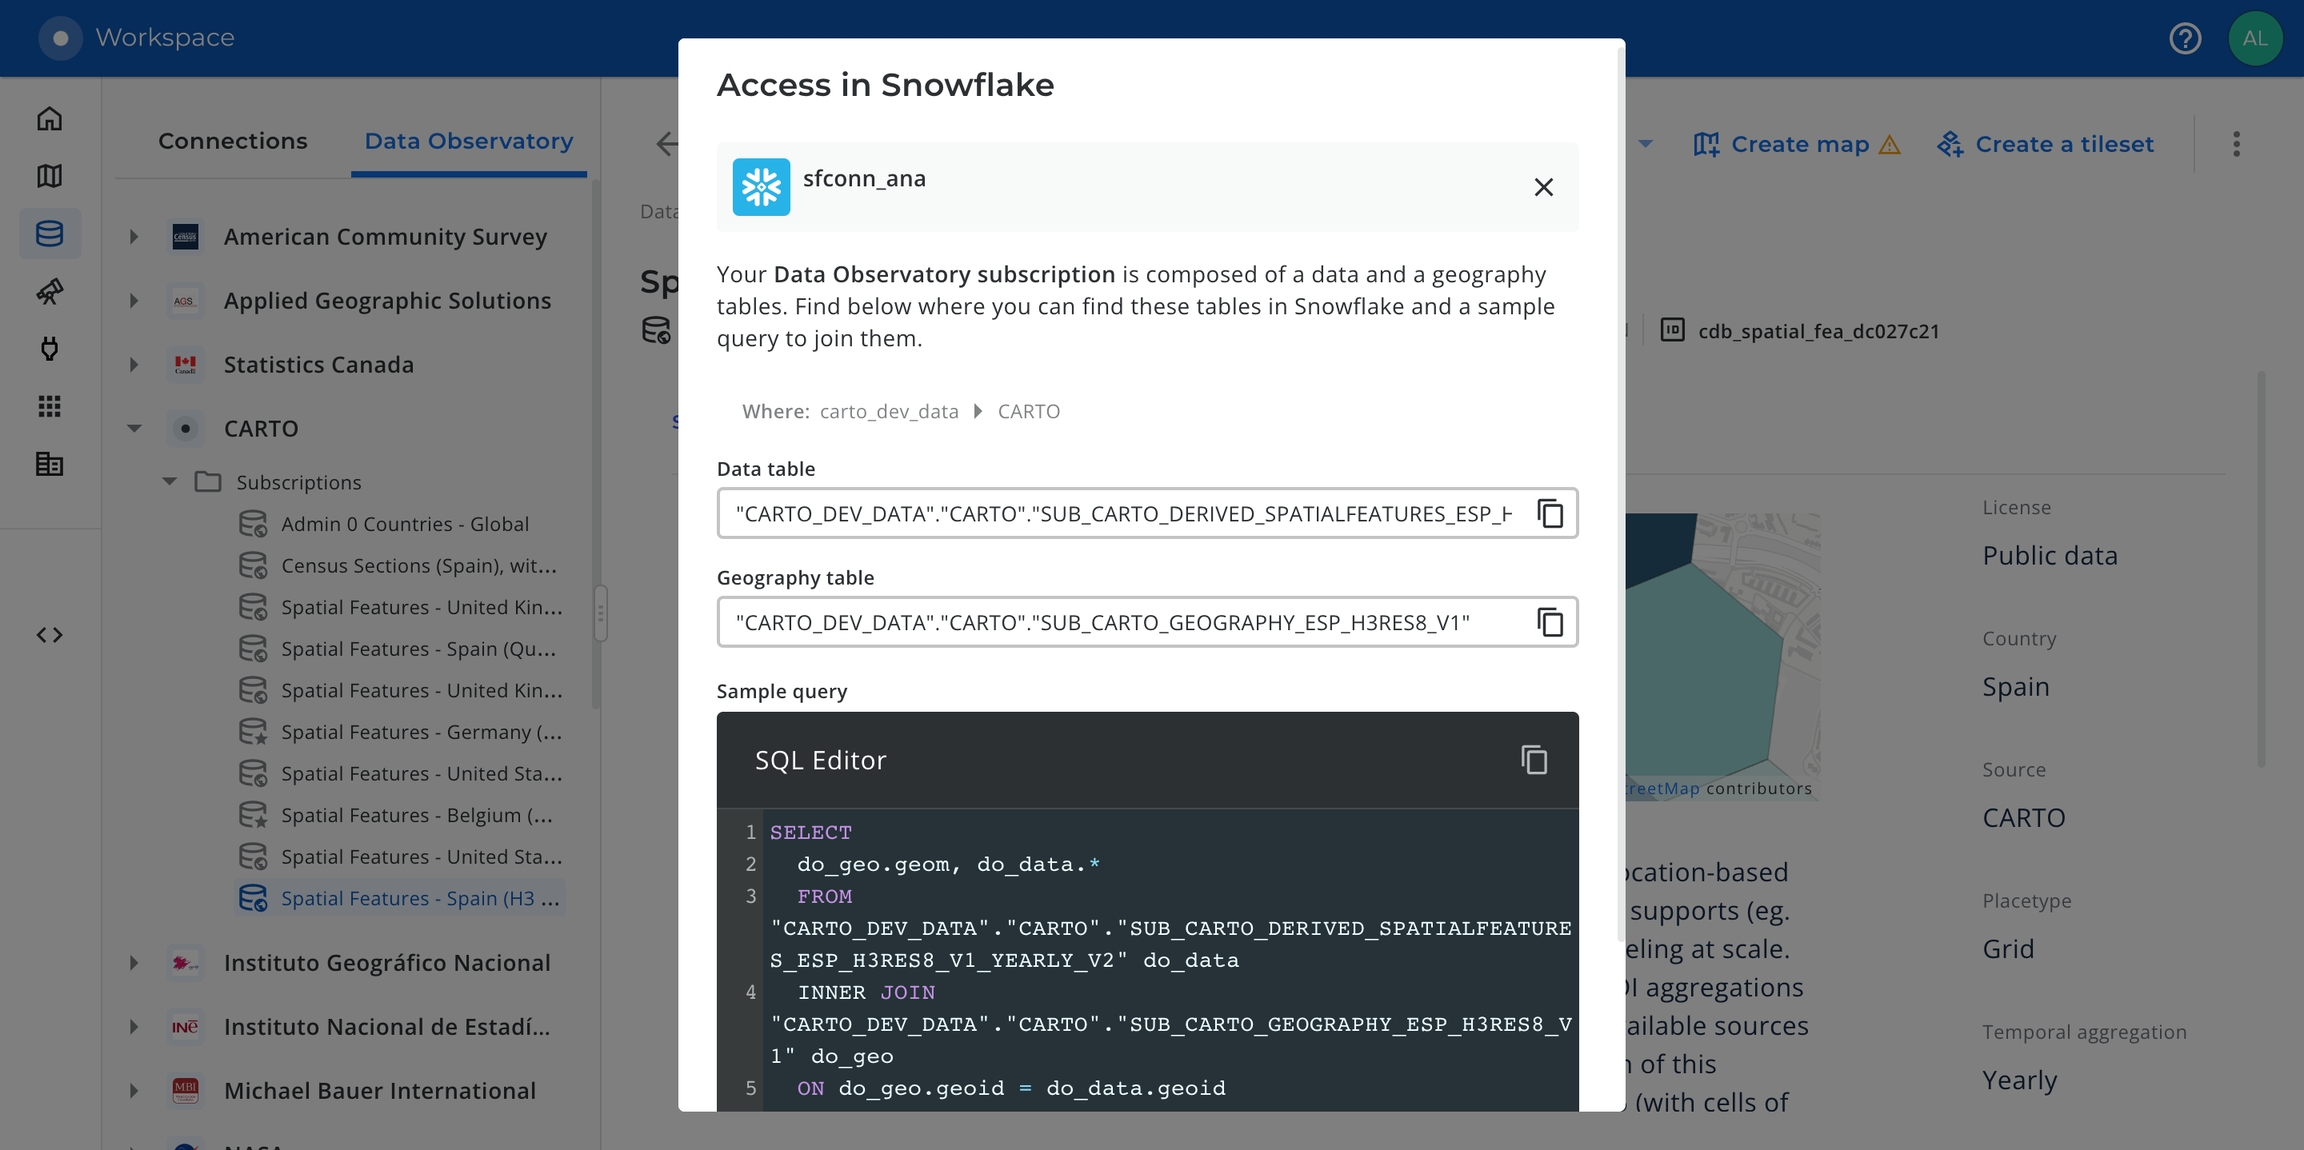
Once our team confirms you that the data subscriptions have been provisioned in your Snowflake account, go back to the “Access in” section of your subscription and copy the Snowflake database and schema where the data has been made available.

Now, in the Snowflake console, confirm that you can see all the relevant data subscriptions by running the command below, which makes use of the
DATAOBS_SUBSCRIPTIONSprocedure. Please replace the Snowflake database and schema with those you copied in the previous step.

3. Choose variables for the enrichment
We can list all the variables (data columns) available in our Data Observatory subscriptions by running the following query, which makes use of the DATAOBS_SUBSCRIPTION_VARIABLES procedure. Please remember to replace the Snowflake database and schema with those you used in the previous command.


In this particular example we are going to enrich our data with the following variables. Please note that these variables are uniquely identified by their variable_slug.
population_3c8da397,retail_4bcd08da,elevation_f0733359andtavg_jan_c35c48dc: these variables are from the CARTO Spatial Features dataset for Spain, aggregated in an H3 grid of resolution 8. As we can see in thevariable_descriptioncolumn, they represent the total population, their number of retail POIs, their average elevation and their average temperature in January, respectively.
4. Run the enrichment
The enrichment is performed using the DATAOBS_ENRICH_POLYGONS procedure of the Analytics Toolbox.
The following inputs are needed:
The input table to be enriched.
The list of variables to be used for the enrichment and their aggregation method. As explained earlier, these variables are identified using their
variable_slug. For more information about the aggregation methods, please refer to the documentation.Name of the output table where the result of the enrichment will be stored.
Location of your Data Observatory subscriptions. This is the same
database.schemawe used to run theDATAOBS_SUBSCRIPTIONSandDATAOBS_SUBSCRIPTION_VARIABLESin previous steps of this guide.

5. Analyze the enrichment result
The table resulting from running the previous query, CENSUSSECTIONDISPLACEDCANARYISLANDS_2020_ENRICHED, will include all the columns of the input table plus four additional columns, containing the value of each enrichment variable in each polygon. As shown below, the enrichment result can be analyzed with the help of a map and a set of interactive widgets created using Builder, our map making tool available from the CARTO Workspace.
To get started creating maps, we recommend the following resources from the documentation:
Guide to add widgets to a map.
Step-by-step tutorial to create a category and bubbles visualization, leveraging different map styles and widgets.
 This project has received funding from the European Union’s Horizon 2020 research and innovation programme under grant agreement No 960401.
Last updated
Was this helpful?

