Minkowski distance to perform cannibalization analysis

Requirements
To run this example you'll need:
The latest version of the Analytics Toolbox Core Native App installed in your Snowflake database
Optional: An active CARTO organization to visualize the results in a map
Example
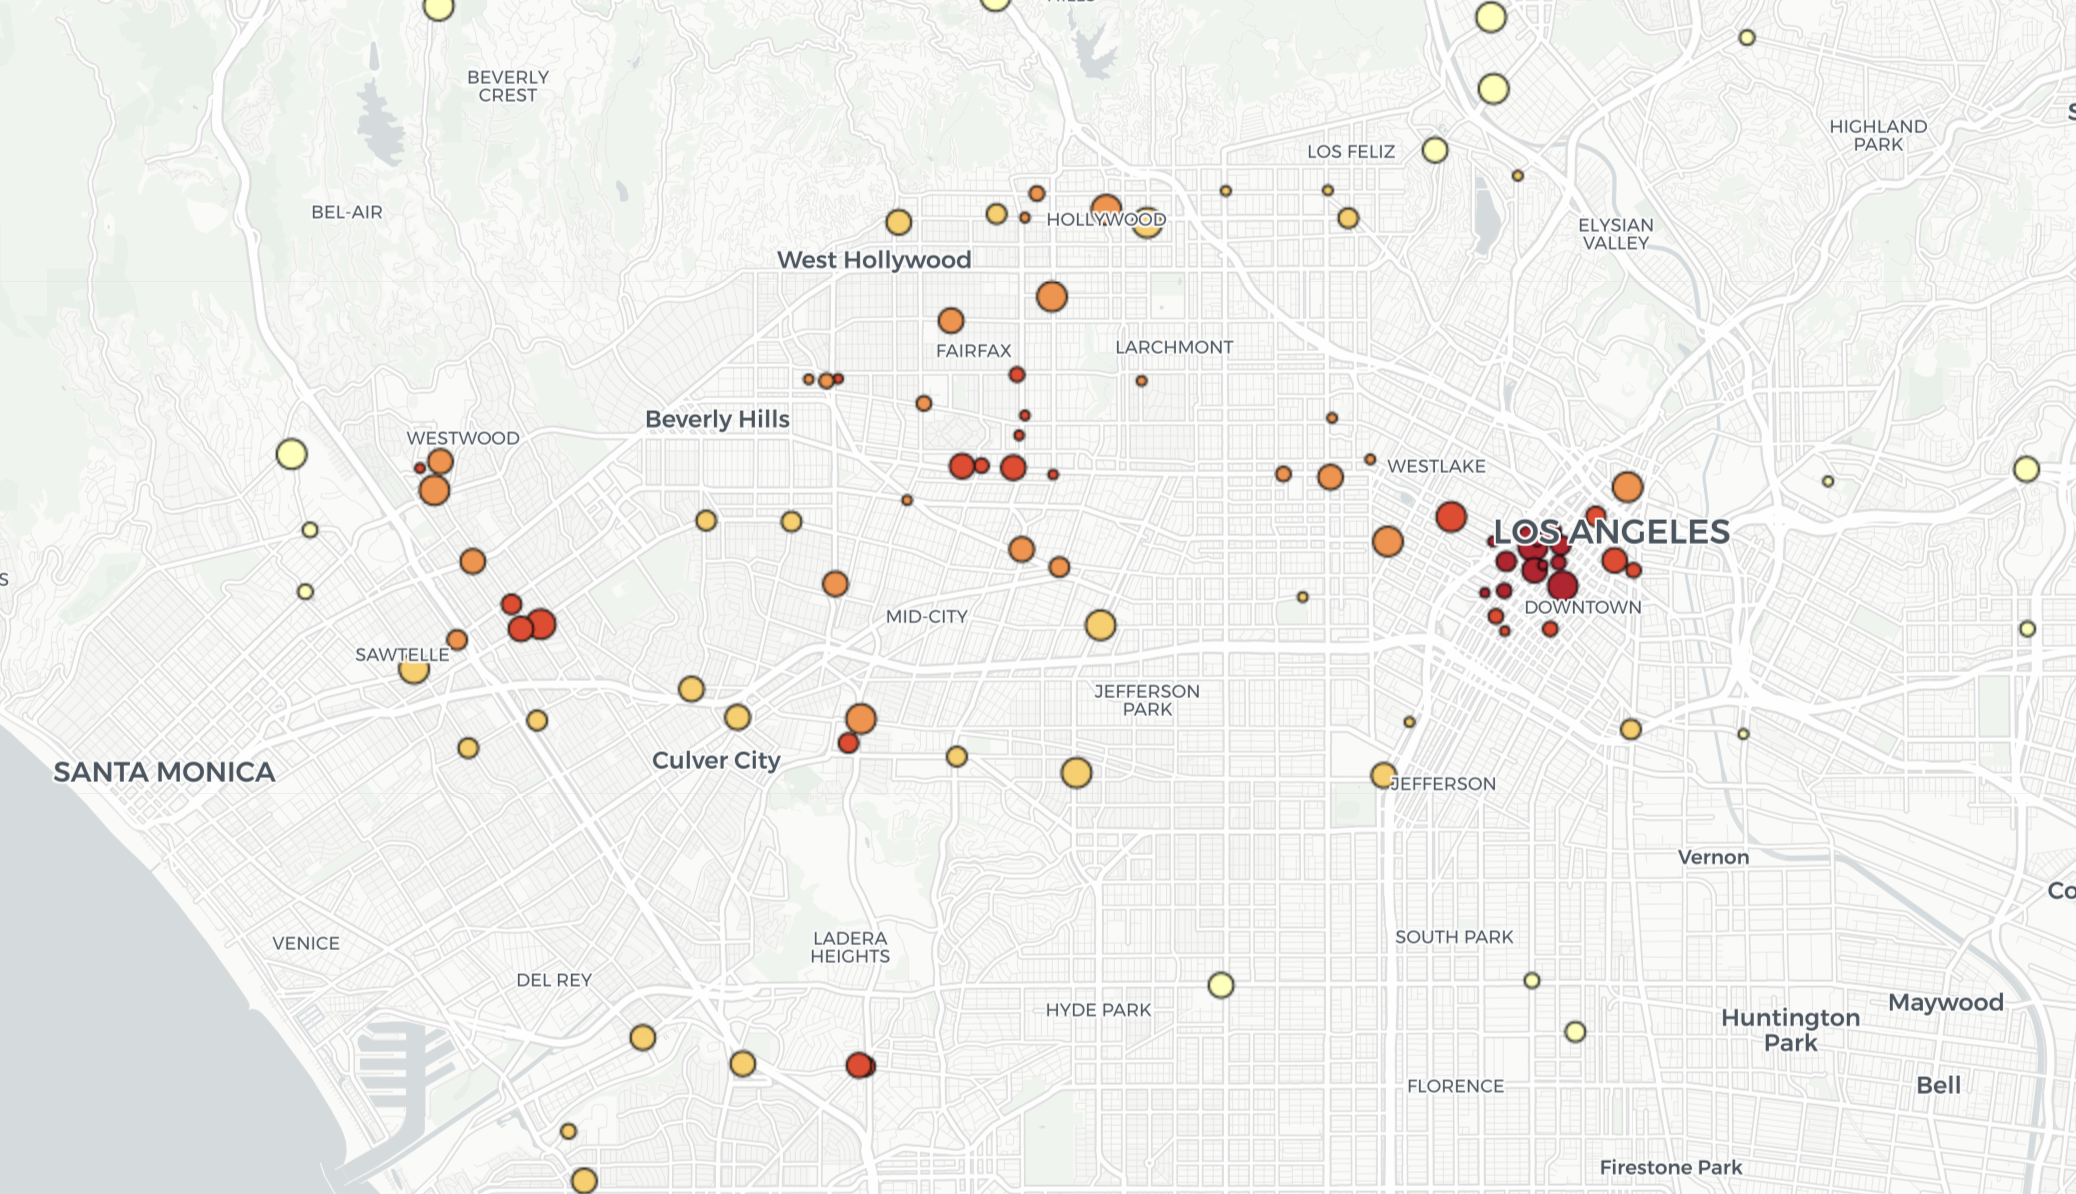
In this example we are going to showcase how to use the Minkowski distance to evaluate cannibalization across Starbucks stores in Los Ángeles, assuming that the ratio of cannibalization depends on the nearby store sizes and the distance to them. As we do not have real data concerning of the store, for the sake of simplicity we are going to use a randomly generated value: starbucks_size.
The first step consists of cross joining the data in order to extract the different Starbucks combinations. Then, we use ST_MINKOWSKIDISTANCE to compute the distances between the different geometries. Notice that since this function returns a matrix, we are using GET to get the position [0, 1] from this matrix.
In the following visualization the size of the dots represent the size of the Starbucks stores and the color represents the level of cannibalization by other stores. It can be identified at first sight how those stores that are surrounded by other big stores appear in darker color than the isolated ones.

Last updated
Was this helpful?

