LogoLogo
HomeDocumentationLoginTry for free
  • CARTO Academy
  • Working with geospatial data
    • Geospatial data: the basics
      • What is location data?
      • Types of location data
      • Changing between types of geographical support
    • Optimizing your data for spatial analysis
    • Introduction to Spatial Indexes
      • Spatial Index support in CARTO
      • Create or enrich an index
      • Work with unique Spatial Index properties
      • Scaling common geoprocessing tasks with Spatial Indexes
      • Using Spatial Indexes for analysis
        • Calculating traffic accident rates
        • Which cell phone towers serve the most people?
    • The modern geospatial analysis stack
      • Spatial data management and analytics with CARTO QGIS Plugin
      • Using data from a REST API for real-time updates
  • Building interactive maps
    • Introduction to CARTO Builder
    • Data sources & map layers
    • Widgets & SQL Parameters
    • AI Agents
    • Data visualization
      • Build a dashboard with styled point locations
      • Style qualitative data using hex color codes
      • Create an animated visualization with time series
      • Visualize administrative regions by defined zoom levels
      • Build a dashboard to understand historic weather events
      • Customize your visualization with tailored-made basemaps
      • Visualize static geometries with attributes varying over time
      • Mapping the precipitation impact of Hurricane Milton with raster data
    • Data analysis
      • Filtering multiple data sources simultaneously with SQL Parameters
      • Generate a dynamic index based on user-defined weighted variables
      • Create a dashboard with user-defined analysis using SQL Parameters
      • Analyzing multiple drive-time catchment areas dynamically
      • Extract insights from your maps with AI Agents
    • Sharing and collaborating
      • Dynamically control your maps using URL parameters
      • Embedding maps in BI platforms
    • Solving geospatial use-cases
      • Build a store performance monitoring dashboard for retail stores in the USA
      • Analyzing Airbnb ratings in Los Angeles
      • Assessing the damages of La Palma Volcano
    • CARTO Map Gallery
  • Creating workflows
    • Introduction to CARTO Workflows
    • Step-by-step tutorials
      • Creating a composite score for fire risk
      • Spatial Scoring: Measuring merchant attractiveness and performance
      • Using crime data & spatial analysis to assess home insurance risk
      • Identify the best billboards and stores for a multi-channel product launch campaign
      • Estimate the population covered by LTE cells
      • A no-code approach to optimizing OOH advertising locations
      • Optimizing site selection for EV charging stations
      • How to optimize location planning for wind turbines
      • Calculate population living around top retail locations
      • Identifying customers potentially affected by an active fire in California
      • Finding stores in areas with weather risks
      • How to run scalable routing analysis the easy way
      • Geomarketing techniques for targeting sportswear consumers
      • How to use GenAI to optimize your spatial analysis
      • Analyzing origin and destination patterns
      • Understanding accident hotspots
      • Real-Time Flood Claims Analysis
      • Train a classification model to estimate customer churn
      • Space-time anomaly detection for real-time portfolio management
      • Identify buildings in areas with a deficit of cell network antennas
    • Workflow templates
      • Data Preparation
      • Data Enrichment
      • Spatial Indexes
      • Spatial Analysis
      • Generating new spatial data
      • Statistics
      • Retail and CPG
      • Telco
      • Insurance
      • Out Of Home Advertising
      • BigQuery ML
      • Snowflake ML
  • Advanced spatial analytics
    • Introduction to the Analytics Toolbox
    • Spatial Analytics for BigQuery
      • Step-by-step tutorials
        • How to create a composite score with your spatial data
        • Space-time hotspot analysis: Identifying traffic accident hotspots
        • Spacetime hotspot classification: Understanding collision patterns
        • Time series clustering: Identifying areas with similar traffic accident patterns
        • Detecting space-time anomalous regions to improve real estate portfolio management (quick start)
        • Detecting space-time anomalous regions to improve real estate portfolio management
        • Computing the spatial autocorrelation of POIs locations in Berlin
        • Identifying amenity hotspots in Stockholm
        • Applying GWR to understand Airbnb listings prices
        • Analyzing signal coverage with line-of-sight calculation and path loss estimation
        • Generating trade areas based on drive/walk-time isolines
        • Geocoding your address data
        • Find similar locations based on their trade areas
        • Calculating market penetration in CPG with merchant universe matching
        • Measuring merchant attractiveness and performance in CPG with spatial scores
        • Segmenting CPG merchants using trade areas characteristics
        • Store cannibalization: quantifying the effect of opening new stores on your existing network
        • Find Twin Areas of top-performing stores
        • Opening a new Pizza Hut location in Honolulu
        • An H3 grid of Starbucks locations and simple cannibalization analysis
        • Data enrichment using the Data Observatory
        • New police stations based on Chicago crime location clusters
        • Interpolating elevation along a road using kriging
        • Analyzing weather stations coverage using a Voronoi diagram
        • A NYC subway connection graph using Delaunay triangulation
        • Computing US airport connections and route interpolations
        • Identifying earthquake-prone areas in the state of California
        • Bikeshare stations within a San Francisco buffer
        • Census areas in the UK within tiles of multiple resolutions
        • Creating simple tilesets
        • Creating spatial index tilesets
        • Creating aggregation tilesets
        • Using raster and vector data to calculate total rooftop PV potential in the US
        • Using the routing module
      • About Analytics Toolbox regions
    • Spatial Analytics for Snowflake
      • Step-by-step tutorials
        • How to create a composite score with your spatial data
        • Space-time hotspot analysis: Identifying traffic accident hotspots
        • Computing the spatial autocorrelation of POIs locations in Berlin
        • Identifying amenity hotspots in Stockholm
        • Applying GWR to understand Airbnb listings prices
        • Opening a new Pizza Hut location in Honolulu
        • Generating trade areas based on drive/walk-time isolines
        • Geocoding your address data
        • Creating spatial index tilesets
        • A Quadkey grid of stores locations and simple cannibalization analysis
        • Minkowski distance to perform cannibalization analysis
        • Computing US airport connections and route interpolations
        • New supplier offices based on store locations clusters
        • Analyzing store location coverage using a Voronoi diagram
        • Enrichment of catchment areas for store characterization
        • Data enrichment using the Data Observatory
    • Spatial Analytics for Redshift
      • Step-by-step tutorials
        • Generating trade areas based on drive/walk-time isolines
        • Geocoding your address data
        • Creating spatial index tilesets
Powered by GitBook
On this page

Was this helpful?

Export as PDF
  1. Creating workflows
  2. Step-by-step tutorials

Identify the best billboards and stores for a multi-channel product launch campaign

Last updated 12 months ago

Was this helpful?

In this tutorial we are going to select what are the best billboards and retail stores in order to create a targeted product launch marketing campaign across multiple channels: out of home advertising and in-store promotions.

In this example we are going to leverage the H3 spatial index to combine data from multiple tables and perform our analysis. For illustrative purposes, we are going to consider our target audience for the product launch the high income female population between 18 and 40 years old.

In this tutorial we are going to use the following tables available in the “demo data” dataset of your CARTO Data Warehouse connection:

  • newyork_newjersey_ooh_panels

  • newyork_ooh_sample_audience_h3

  • retail_stores

Let's get to it!

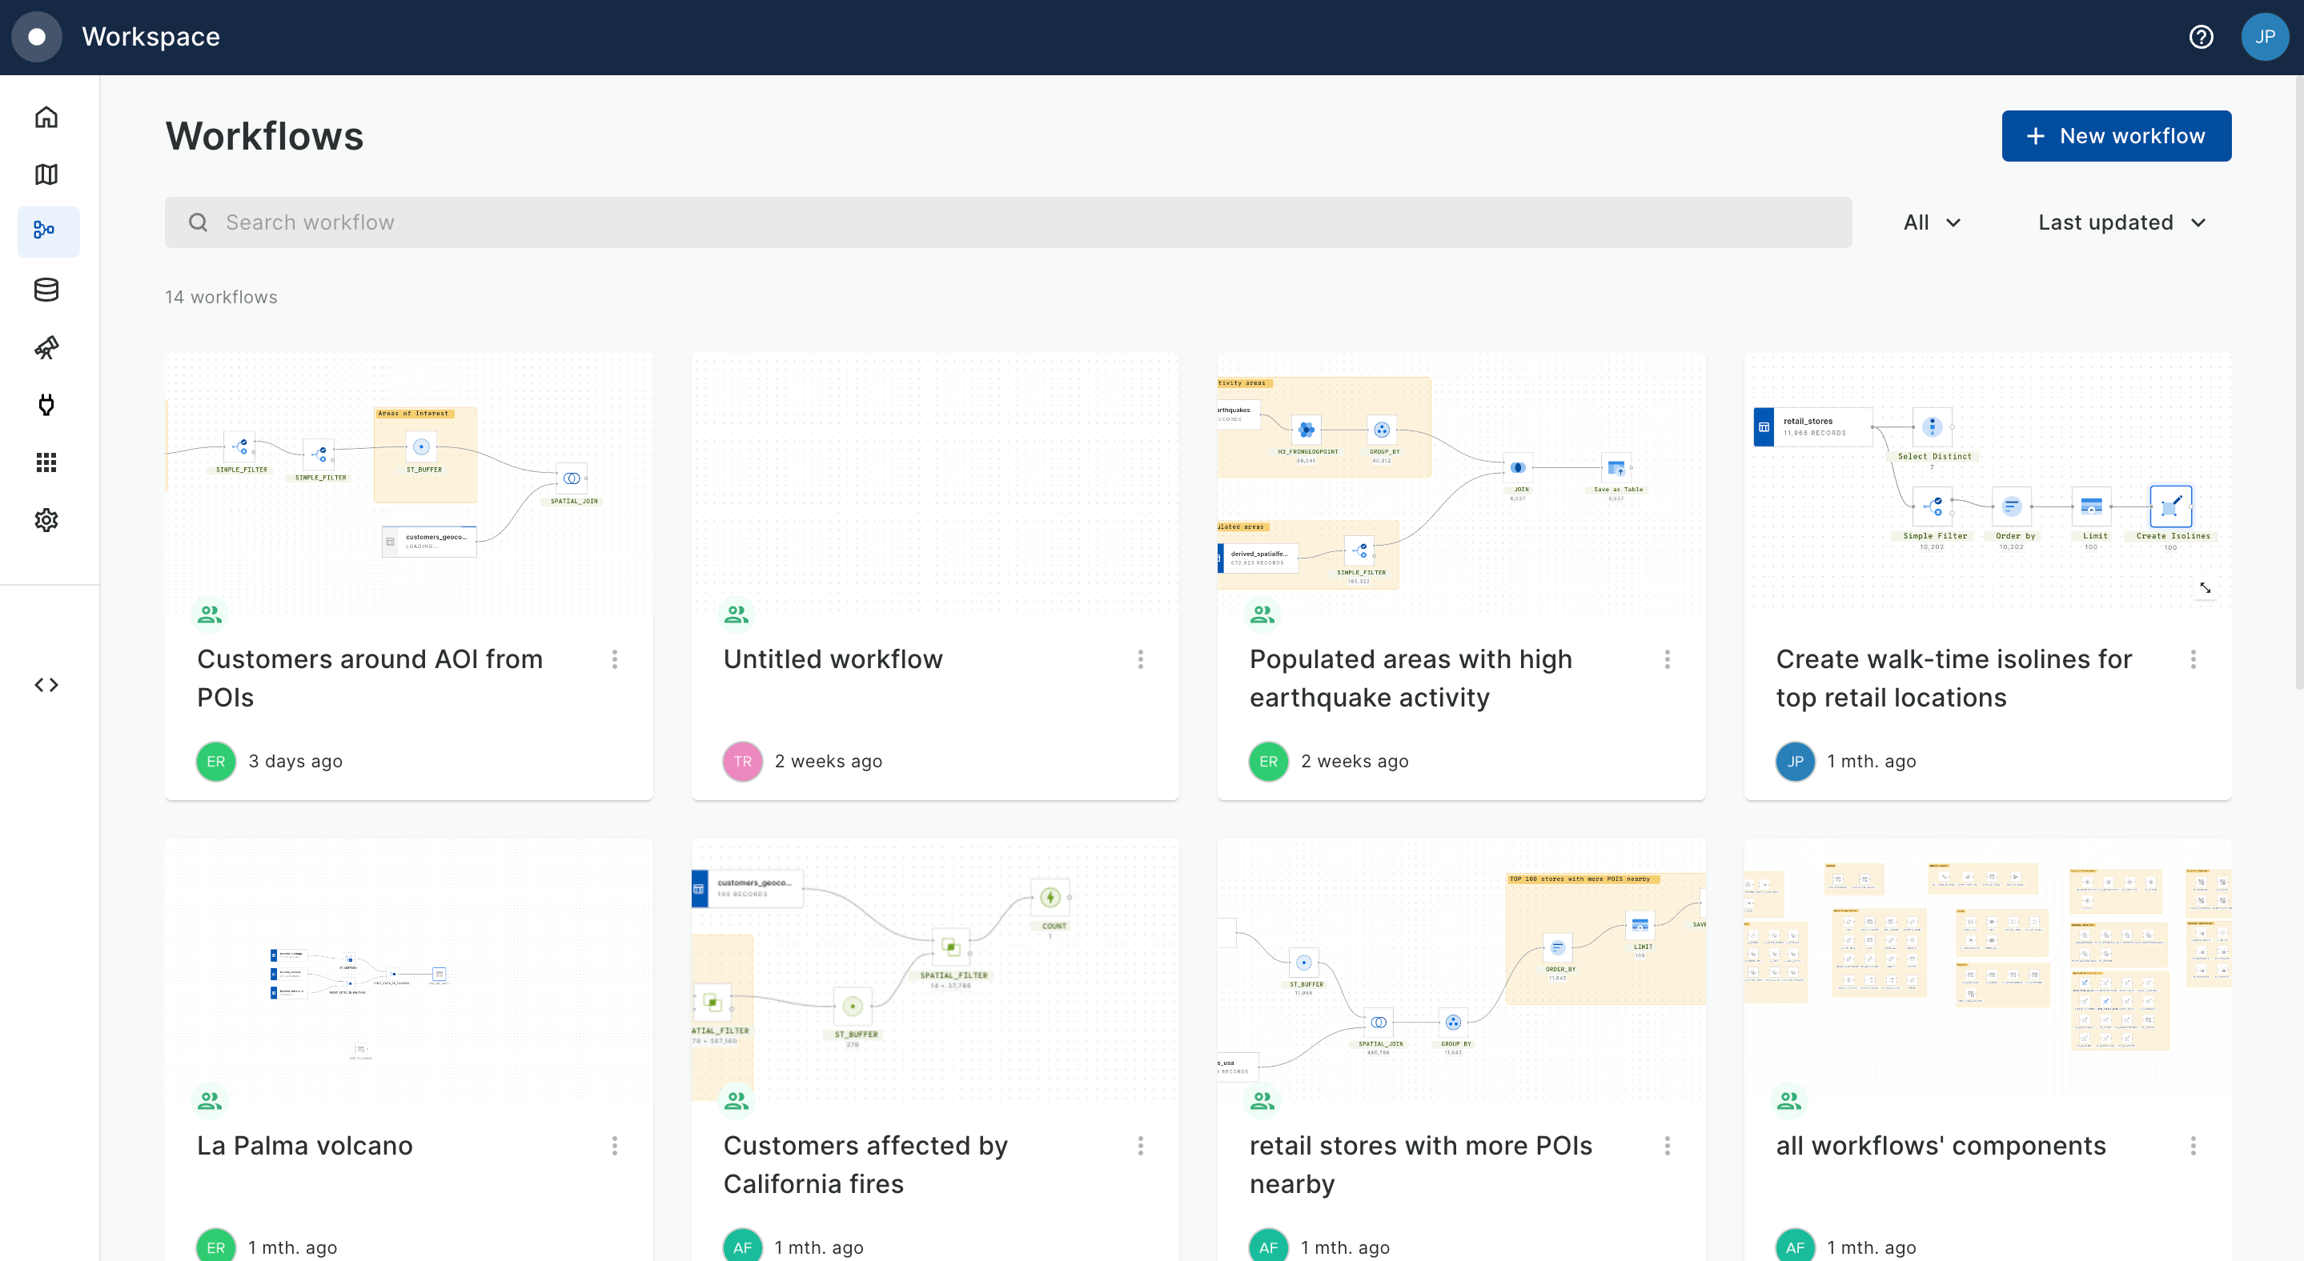
  1. In your CARTO Workspace under the Workflows tab, create a new workflow. In your CARTO Workspace under the Workflows tab, create a new workflow.
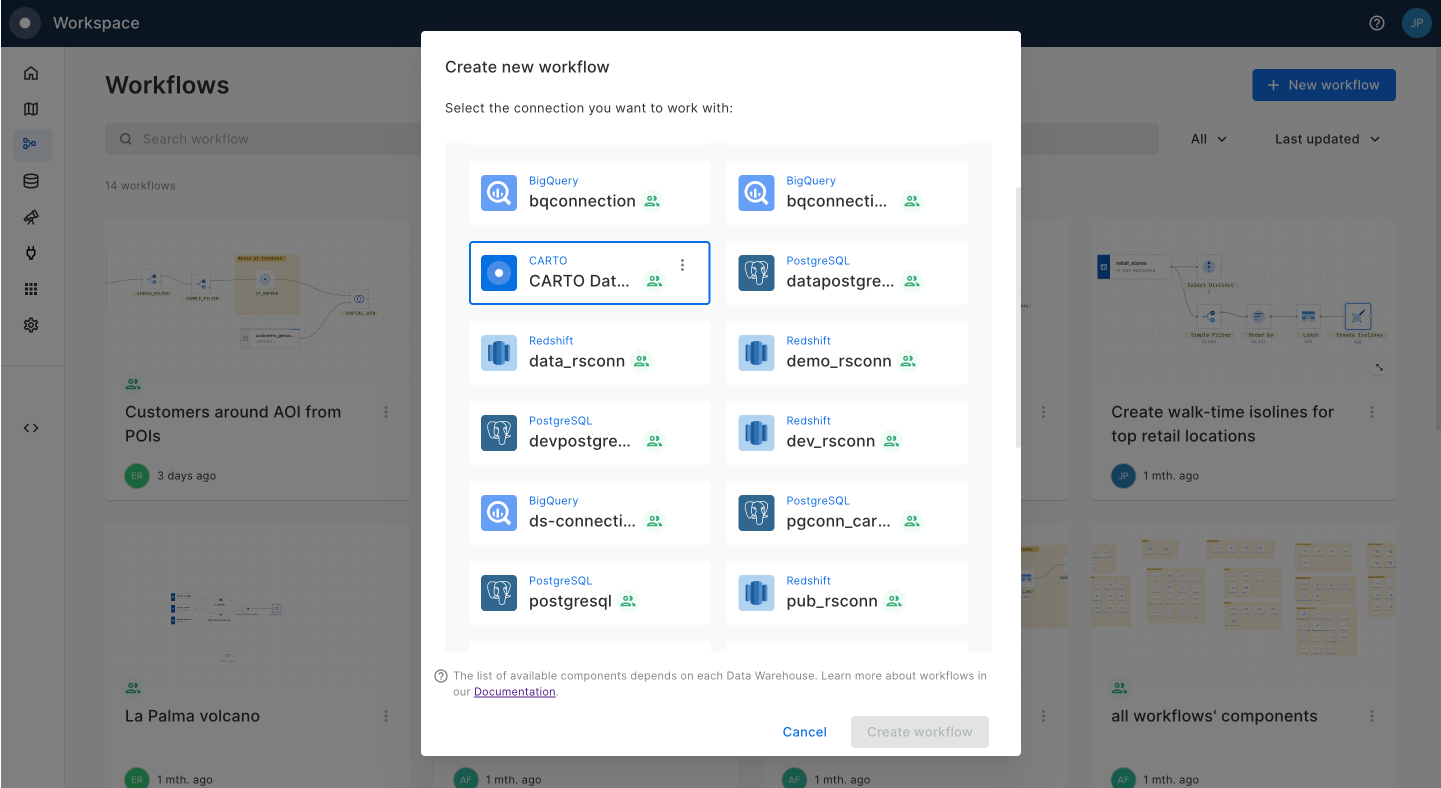
  1. Select the data warehouse where you have the data accessible. We'll be using the CARTO Data Warehouse, which should be available to all users.
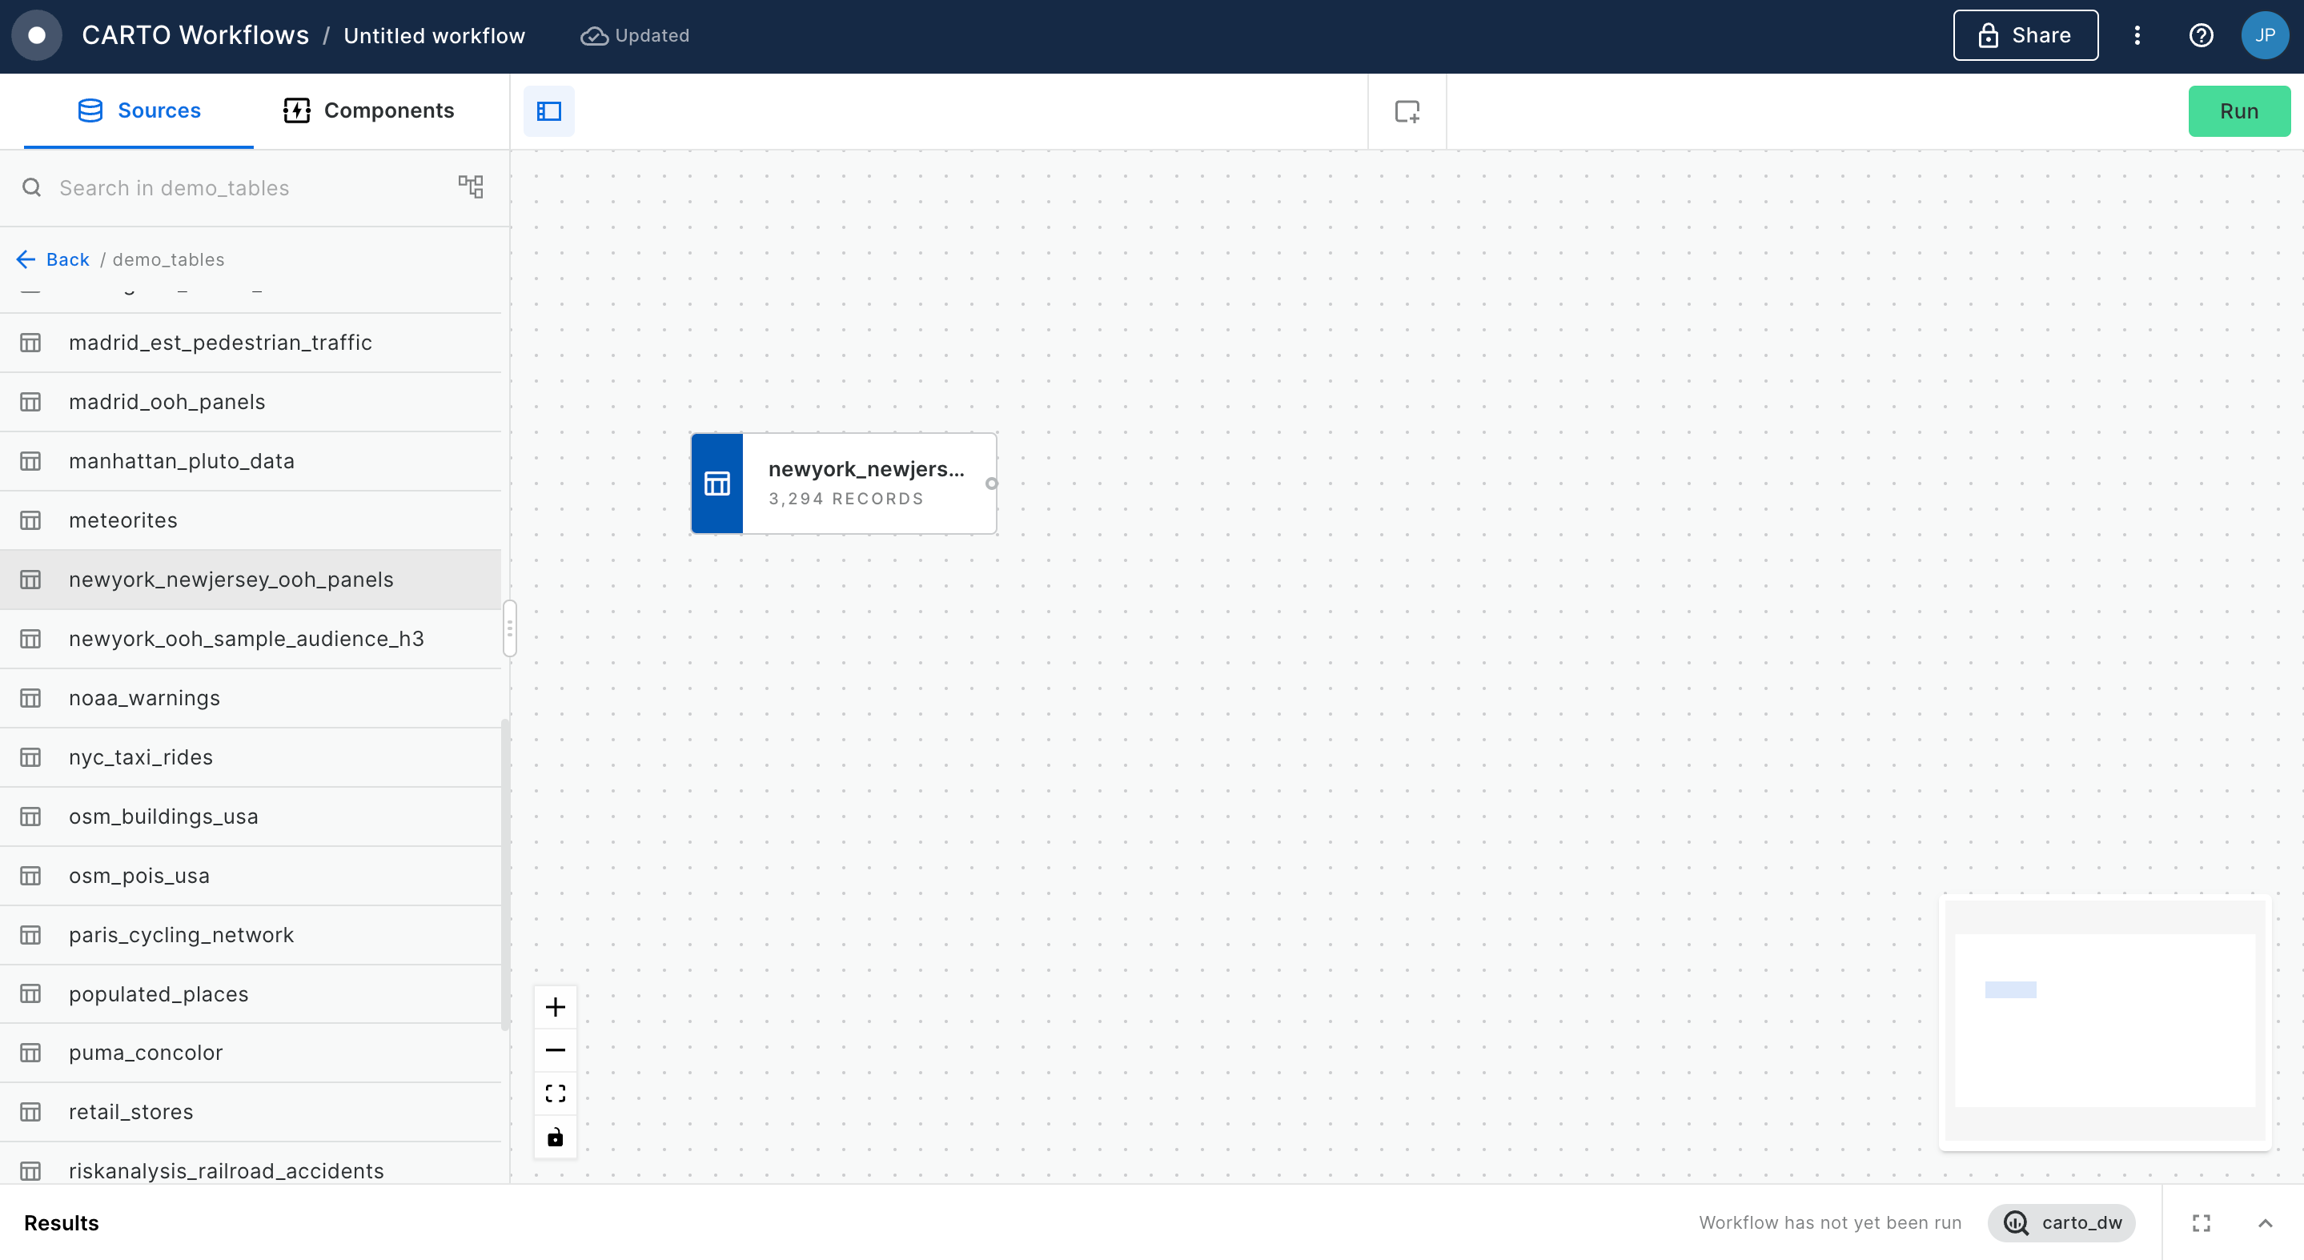
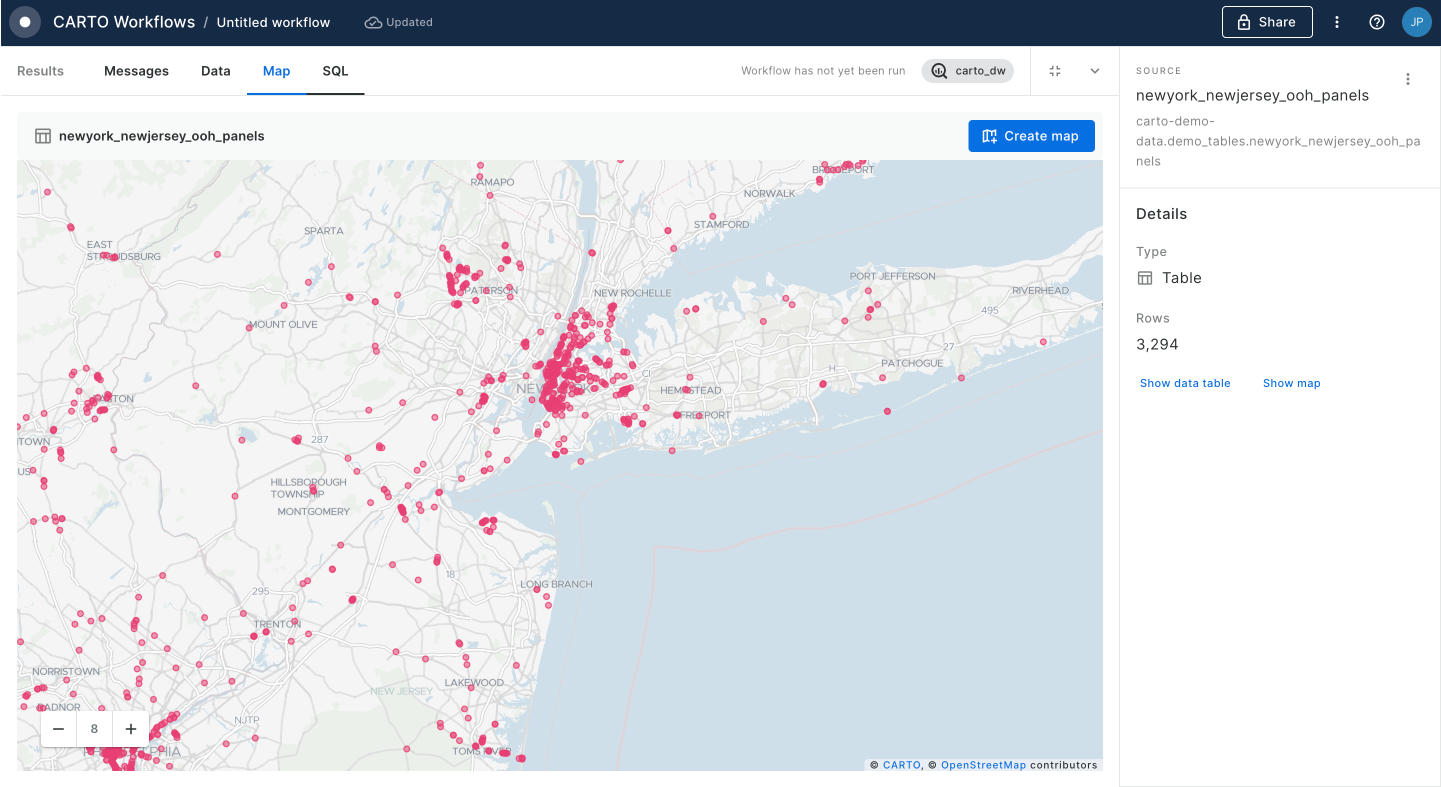
  1. Navigate the data sources panel to locate your table, and drag it onto the canvas. In this example we will be using the newyork_newjersey_ooh_panels table available in demo data. You should be able to preview the data both in tabular and map format.
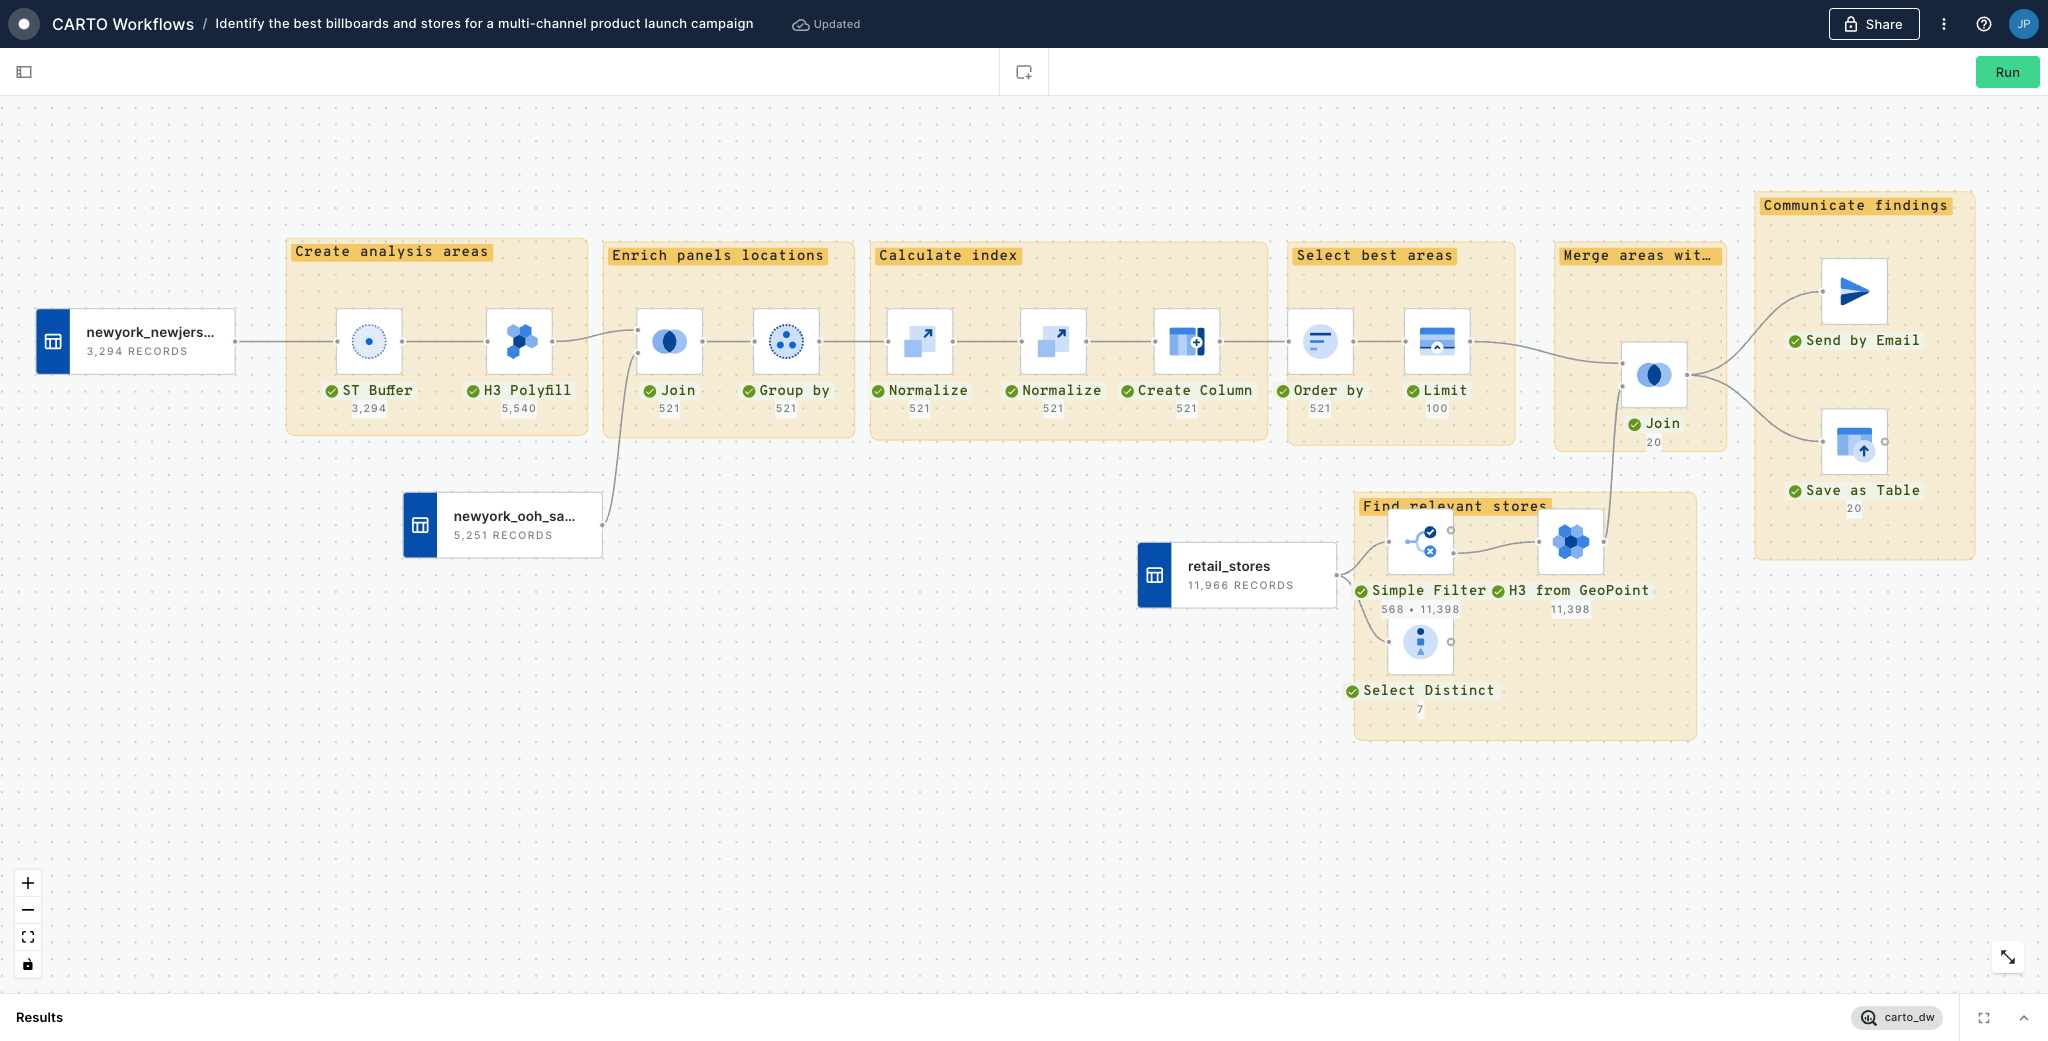
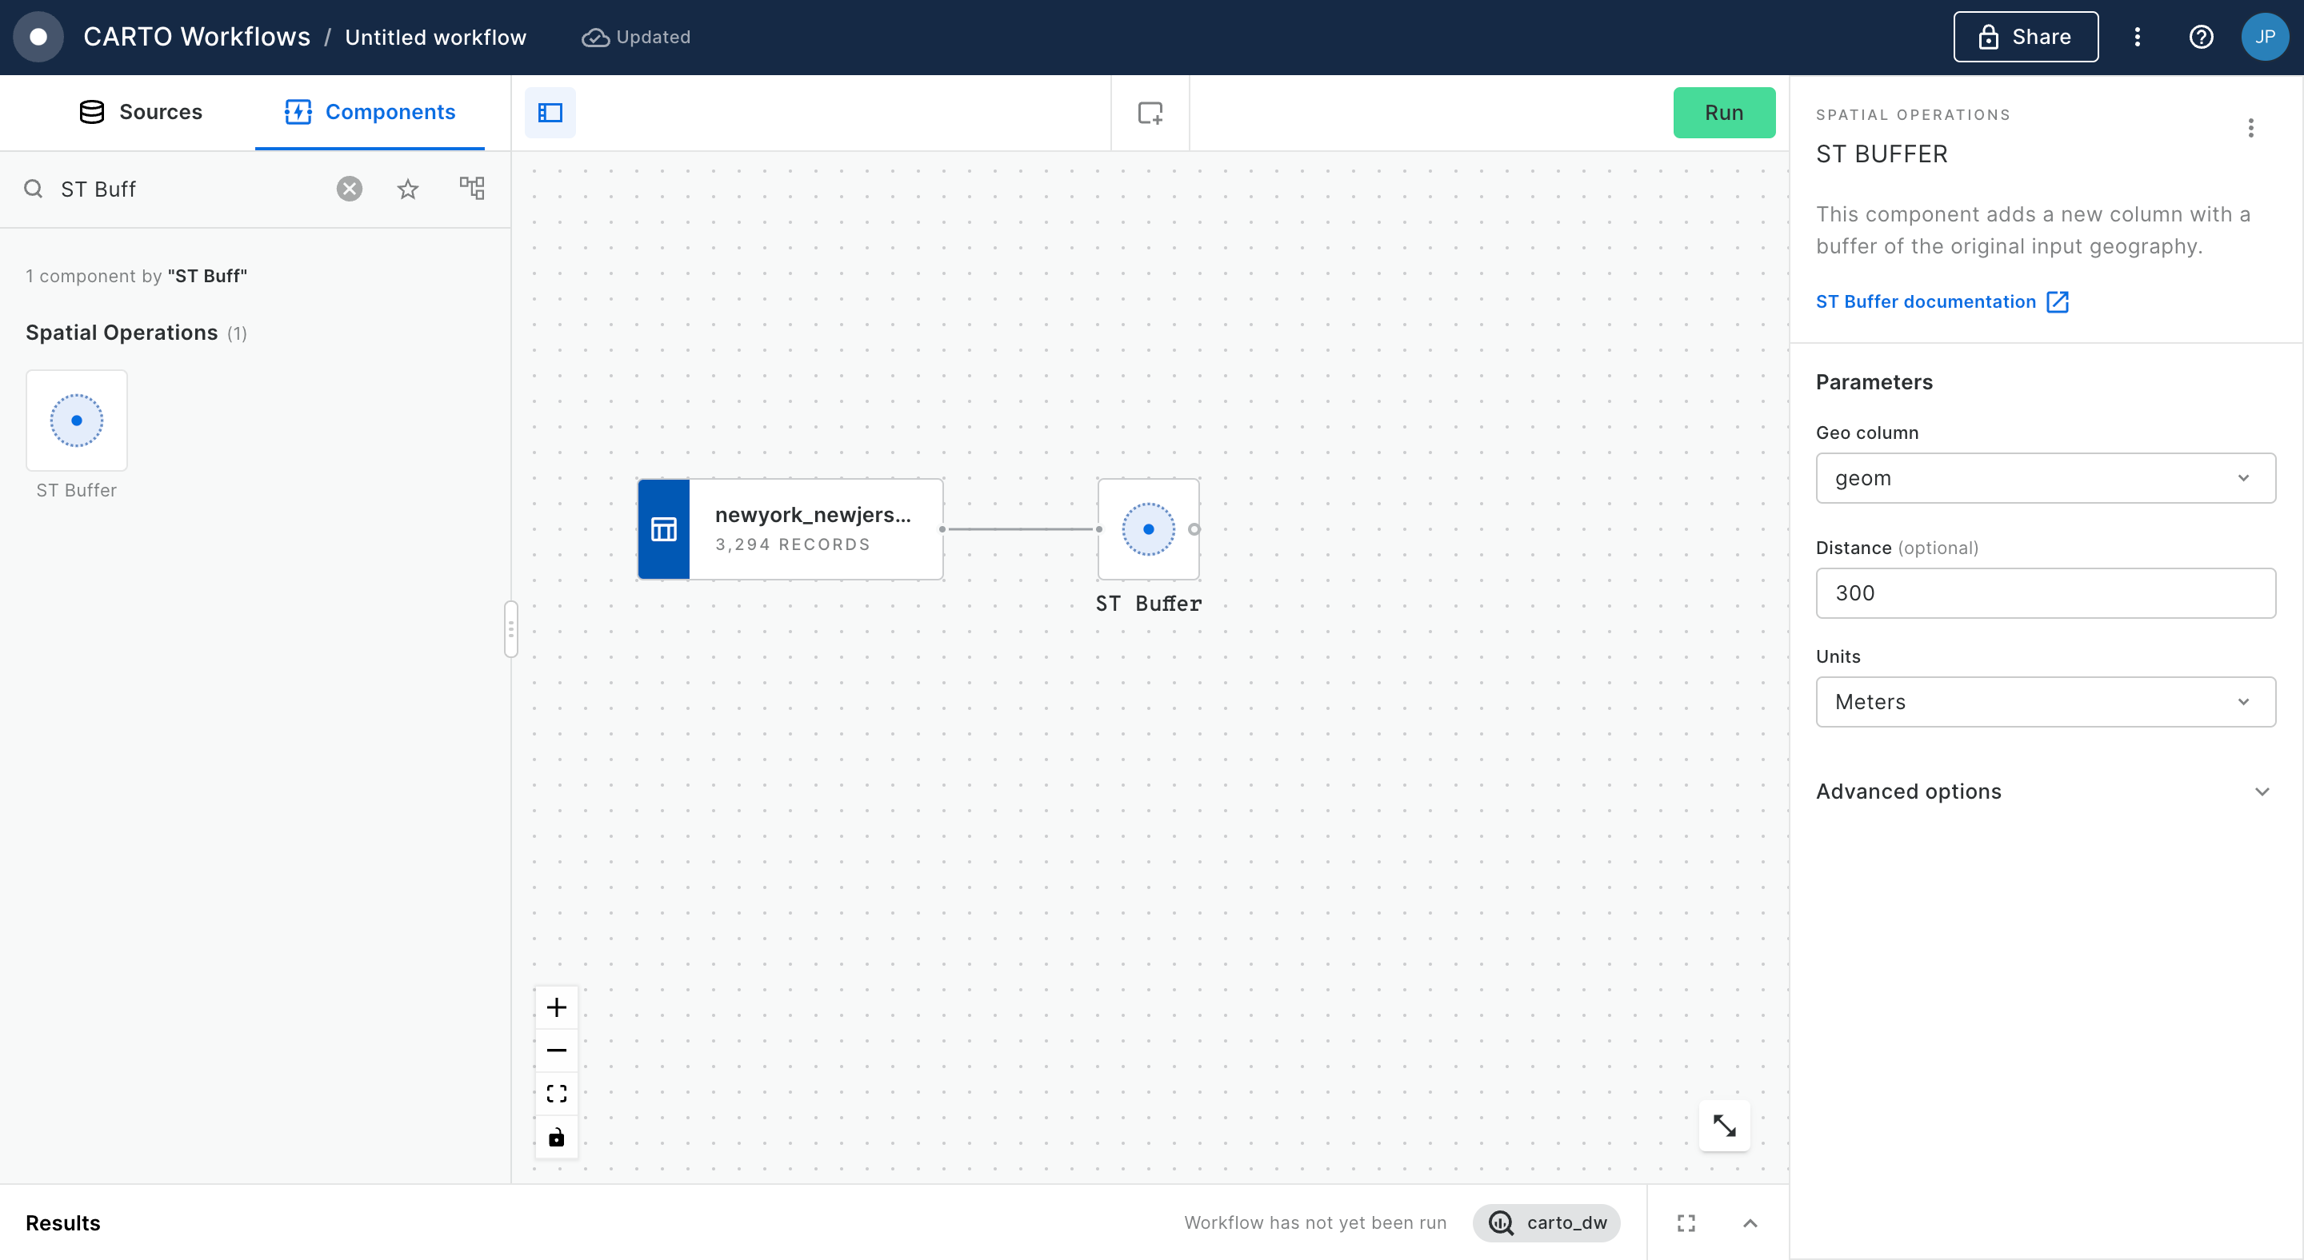
  1. We are going to create 300 meters buffers around each billboard. To do that, we add the ST Buffer component into the canvas and we connect the data source to its input. Then, in the node configuration panel we select 'geom' as the Geo column, '300' as the distance and 'meters' as the units. We click on "Run".
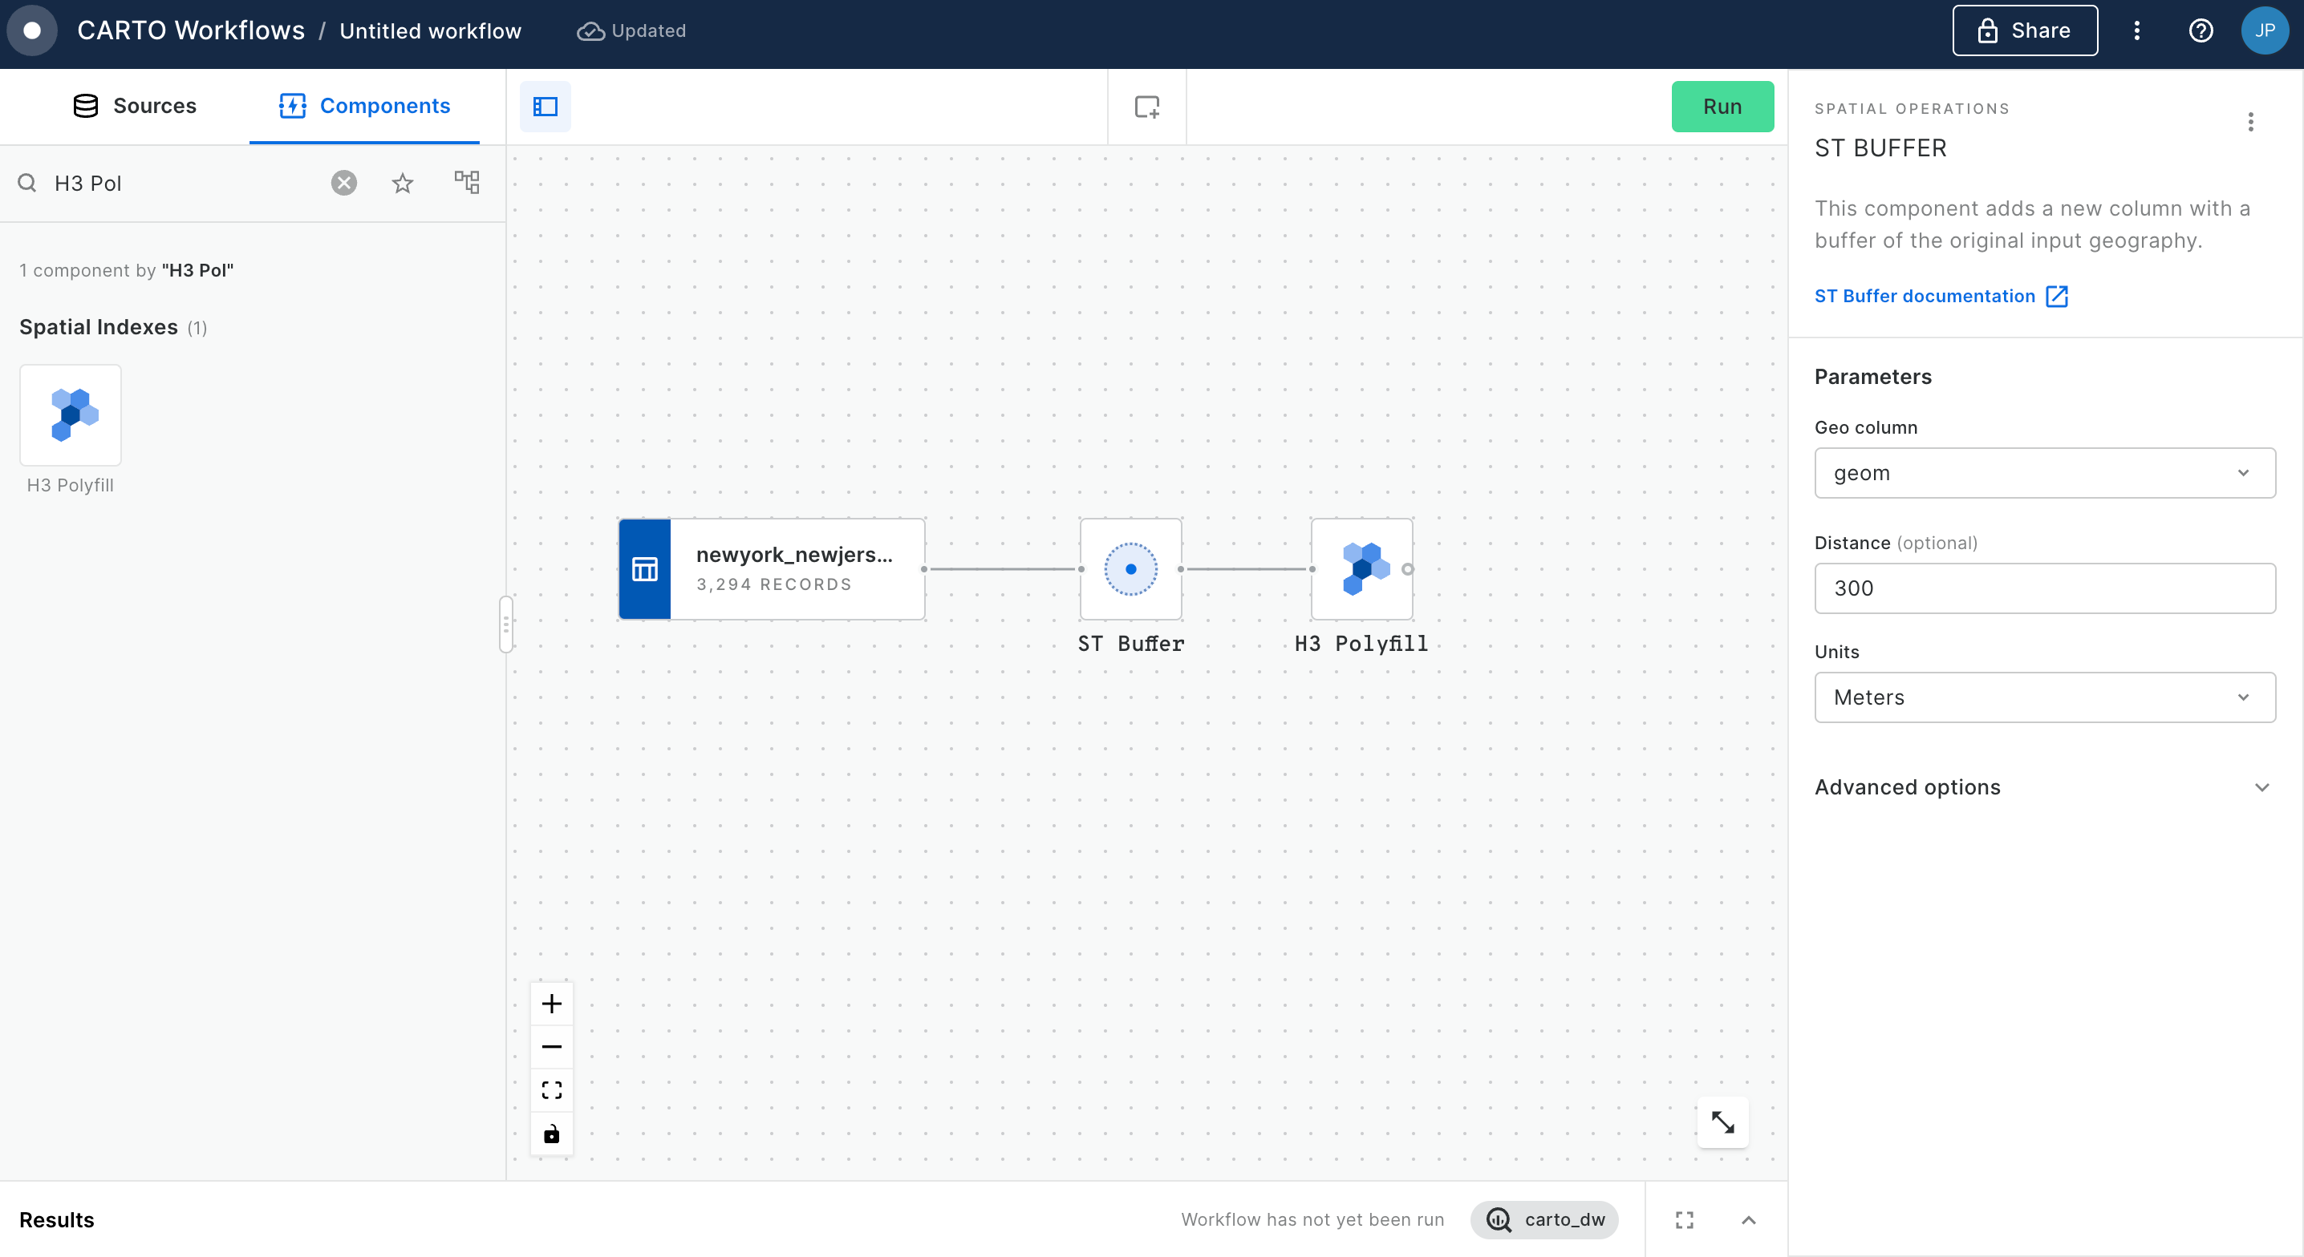
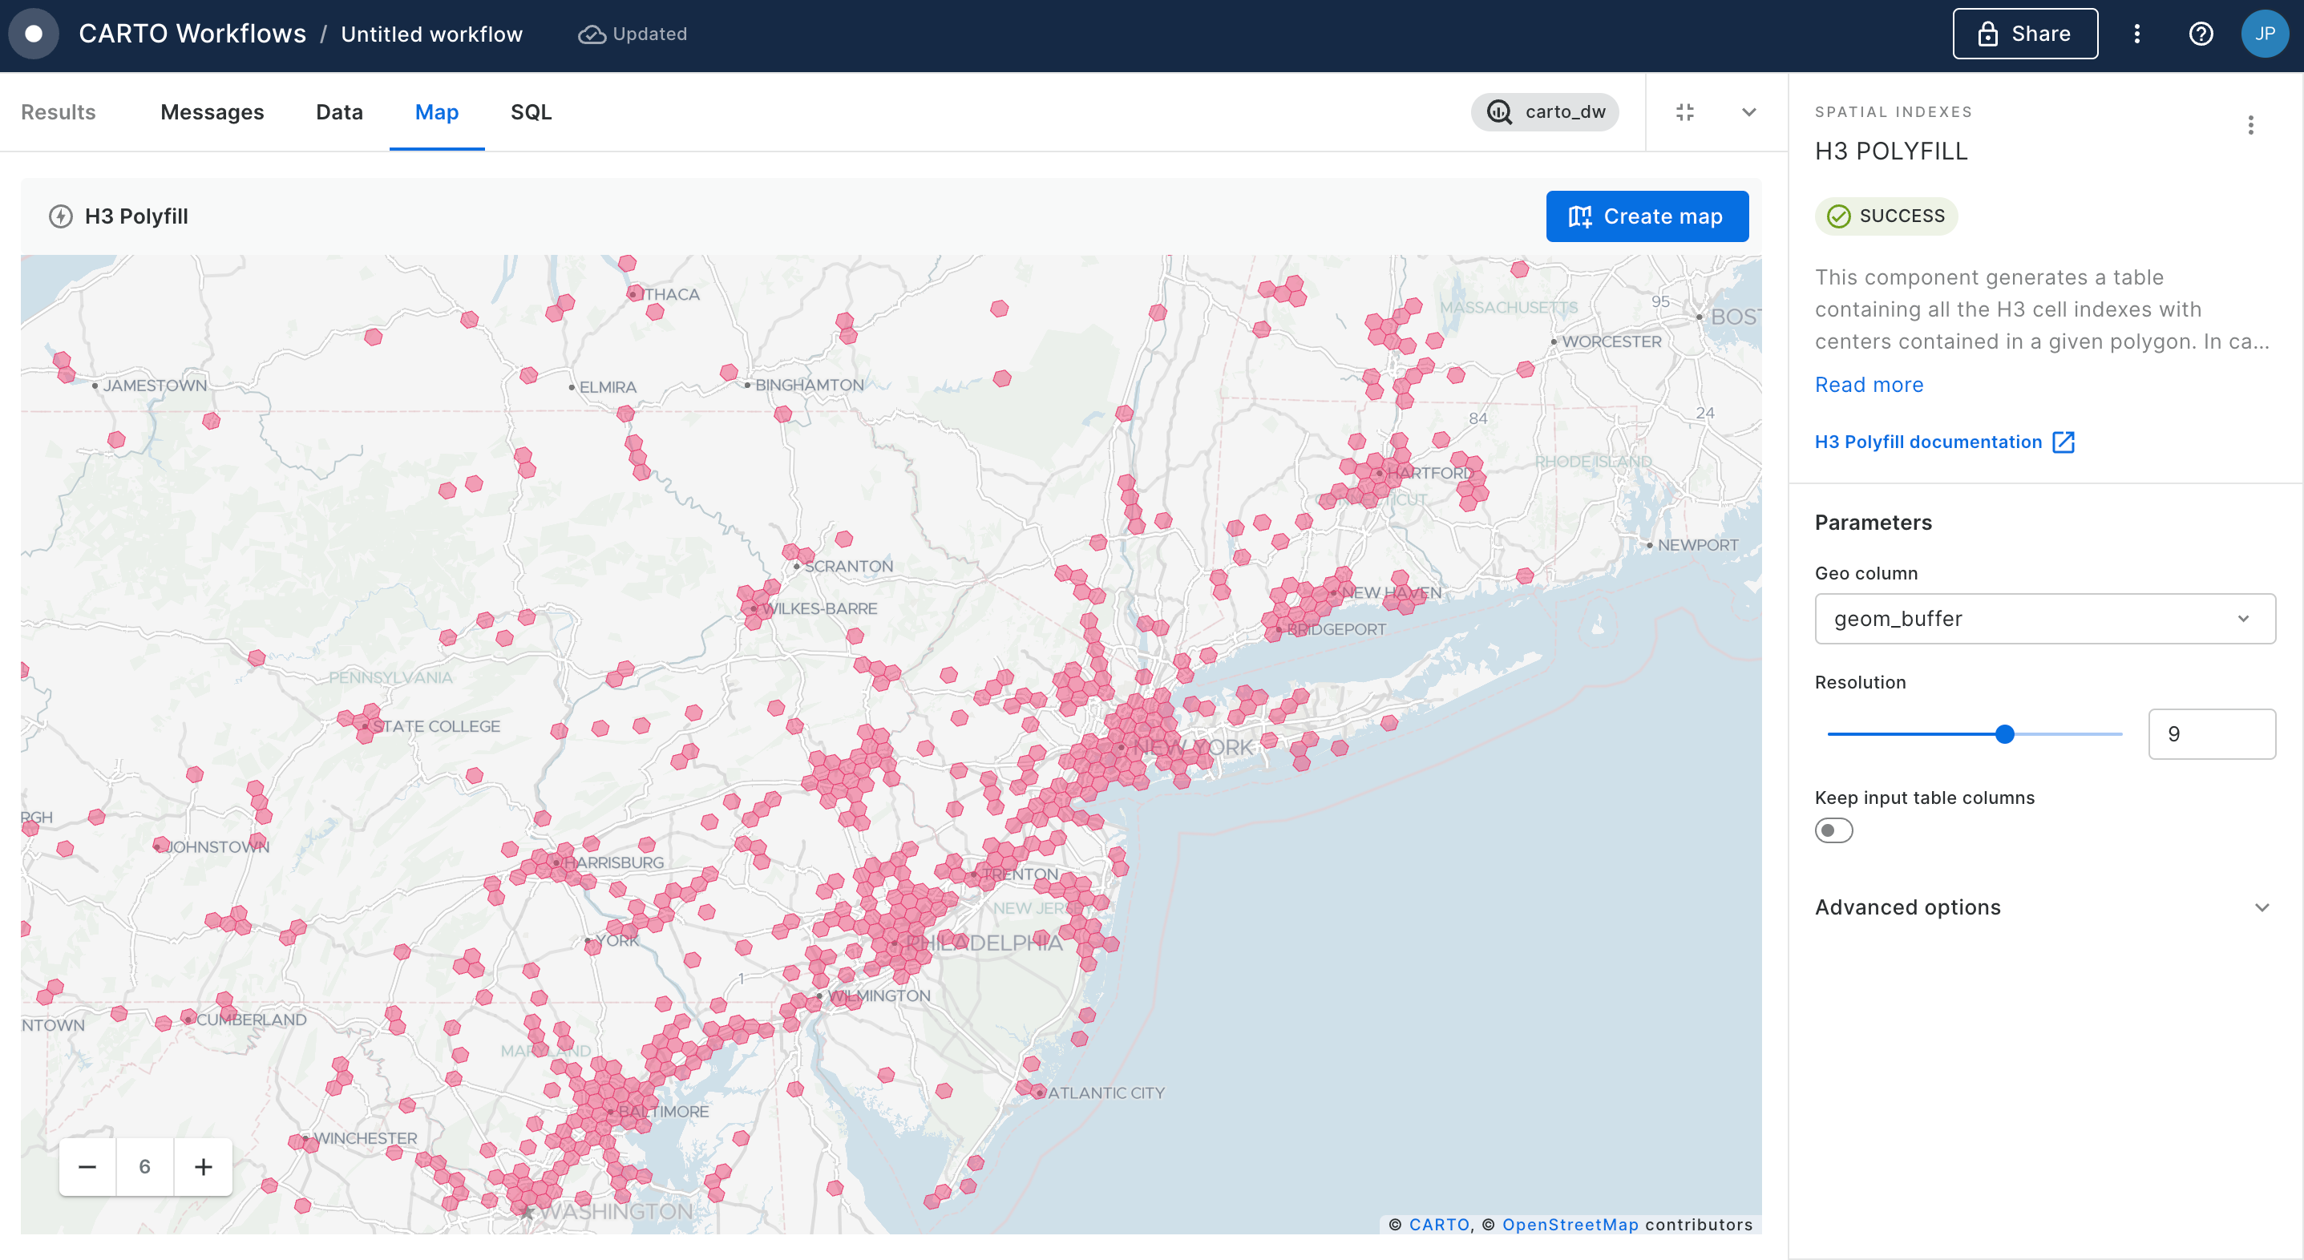
  1. What we are going to do that is to get the H3 Resolution 9 cells that fall within the buffers that we have just created. Then, we are then going to use the H3 indices to enrich the areas with more data that we have available in that spatial support. Hence, the next step is to add the H3 Polyfill component, connect it to the output of the ST Buffer node and configure it to calculate the H3 cells in resolution 9.
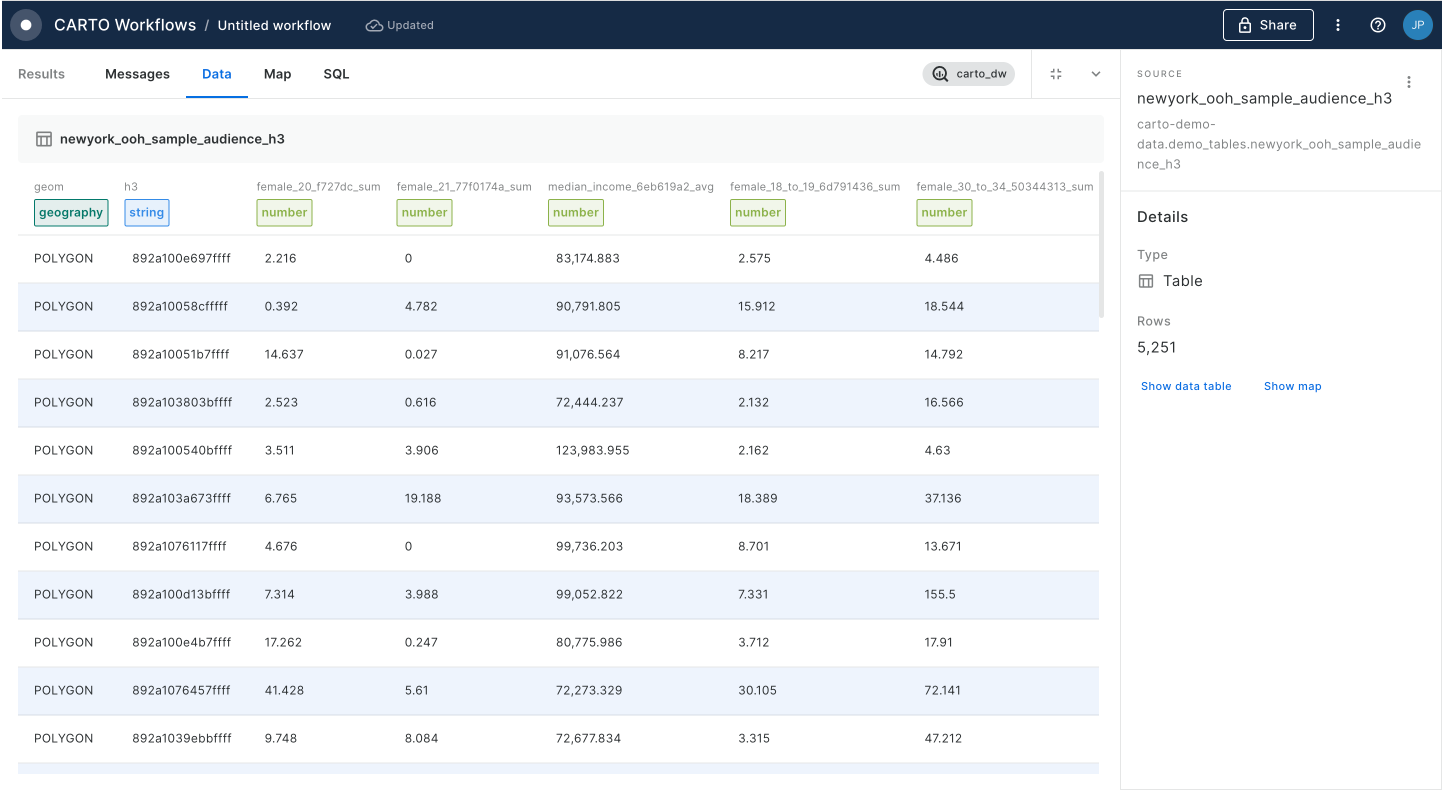
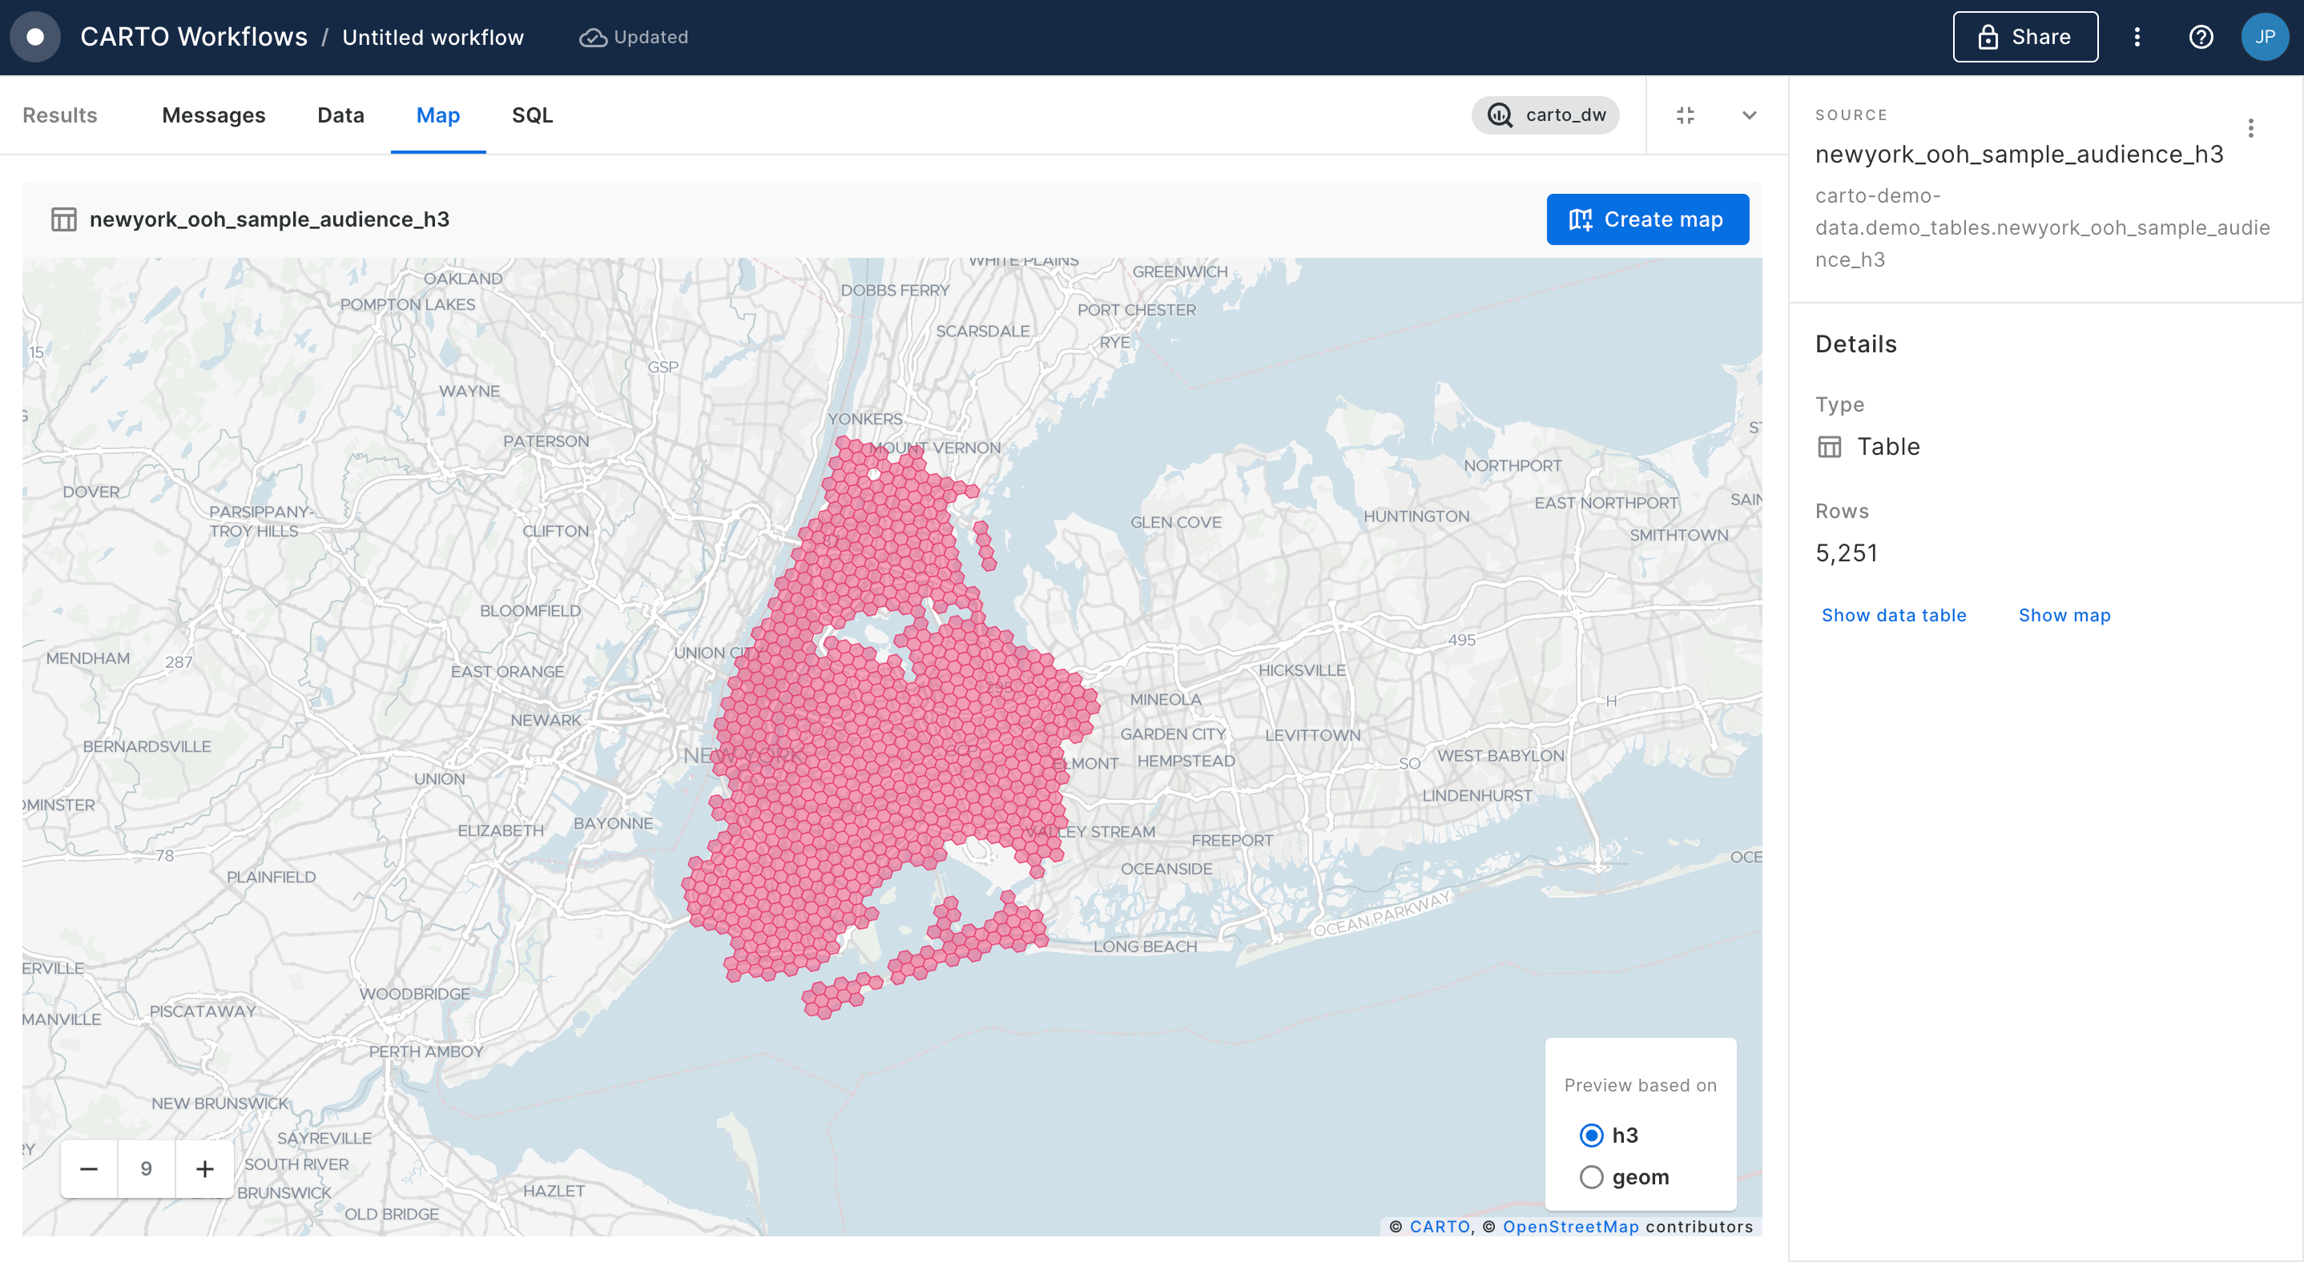
  1. Now we are going to add a new data source to our workflow, specifically the table newyork_ooh_sample_audience_h3 that includes some features that we will use to define our target audience for the product launch. Take some time to analyze the structure of the table; as you can see we have socio-demographic and socio-economic features aggregated at h3 level in the NYC area.
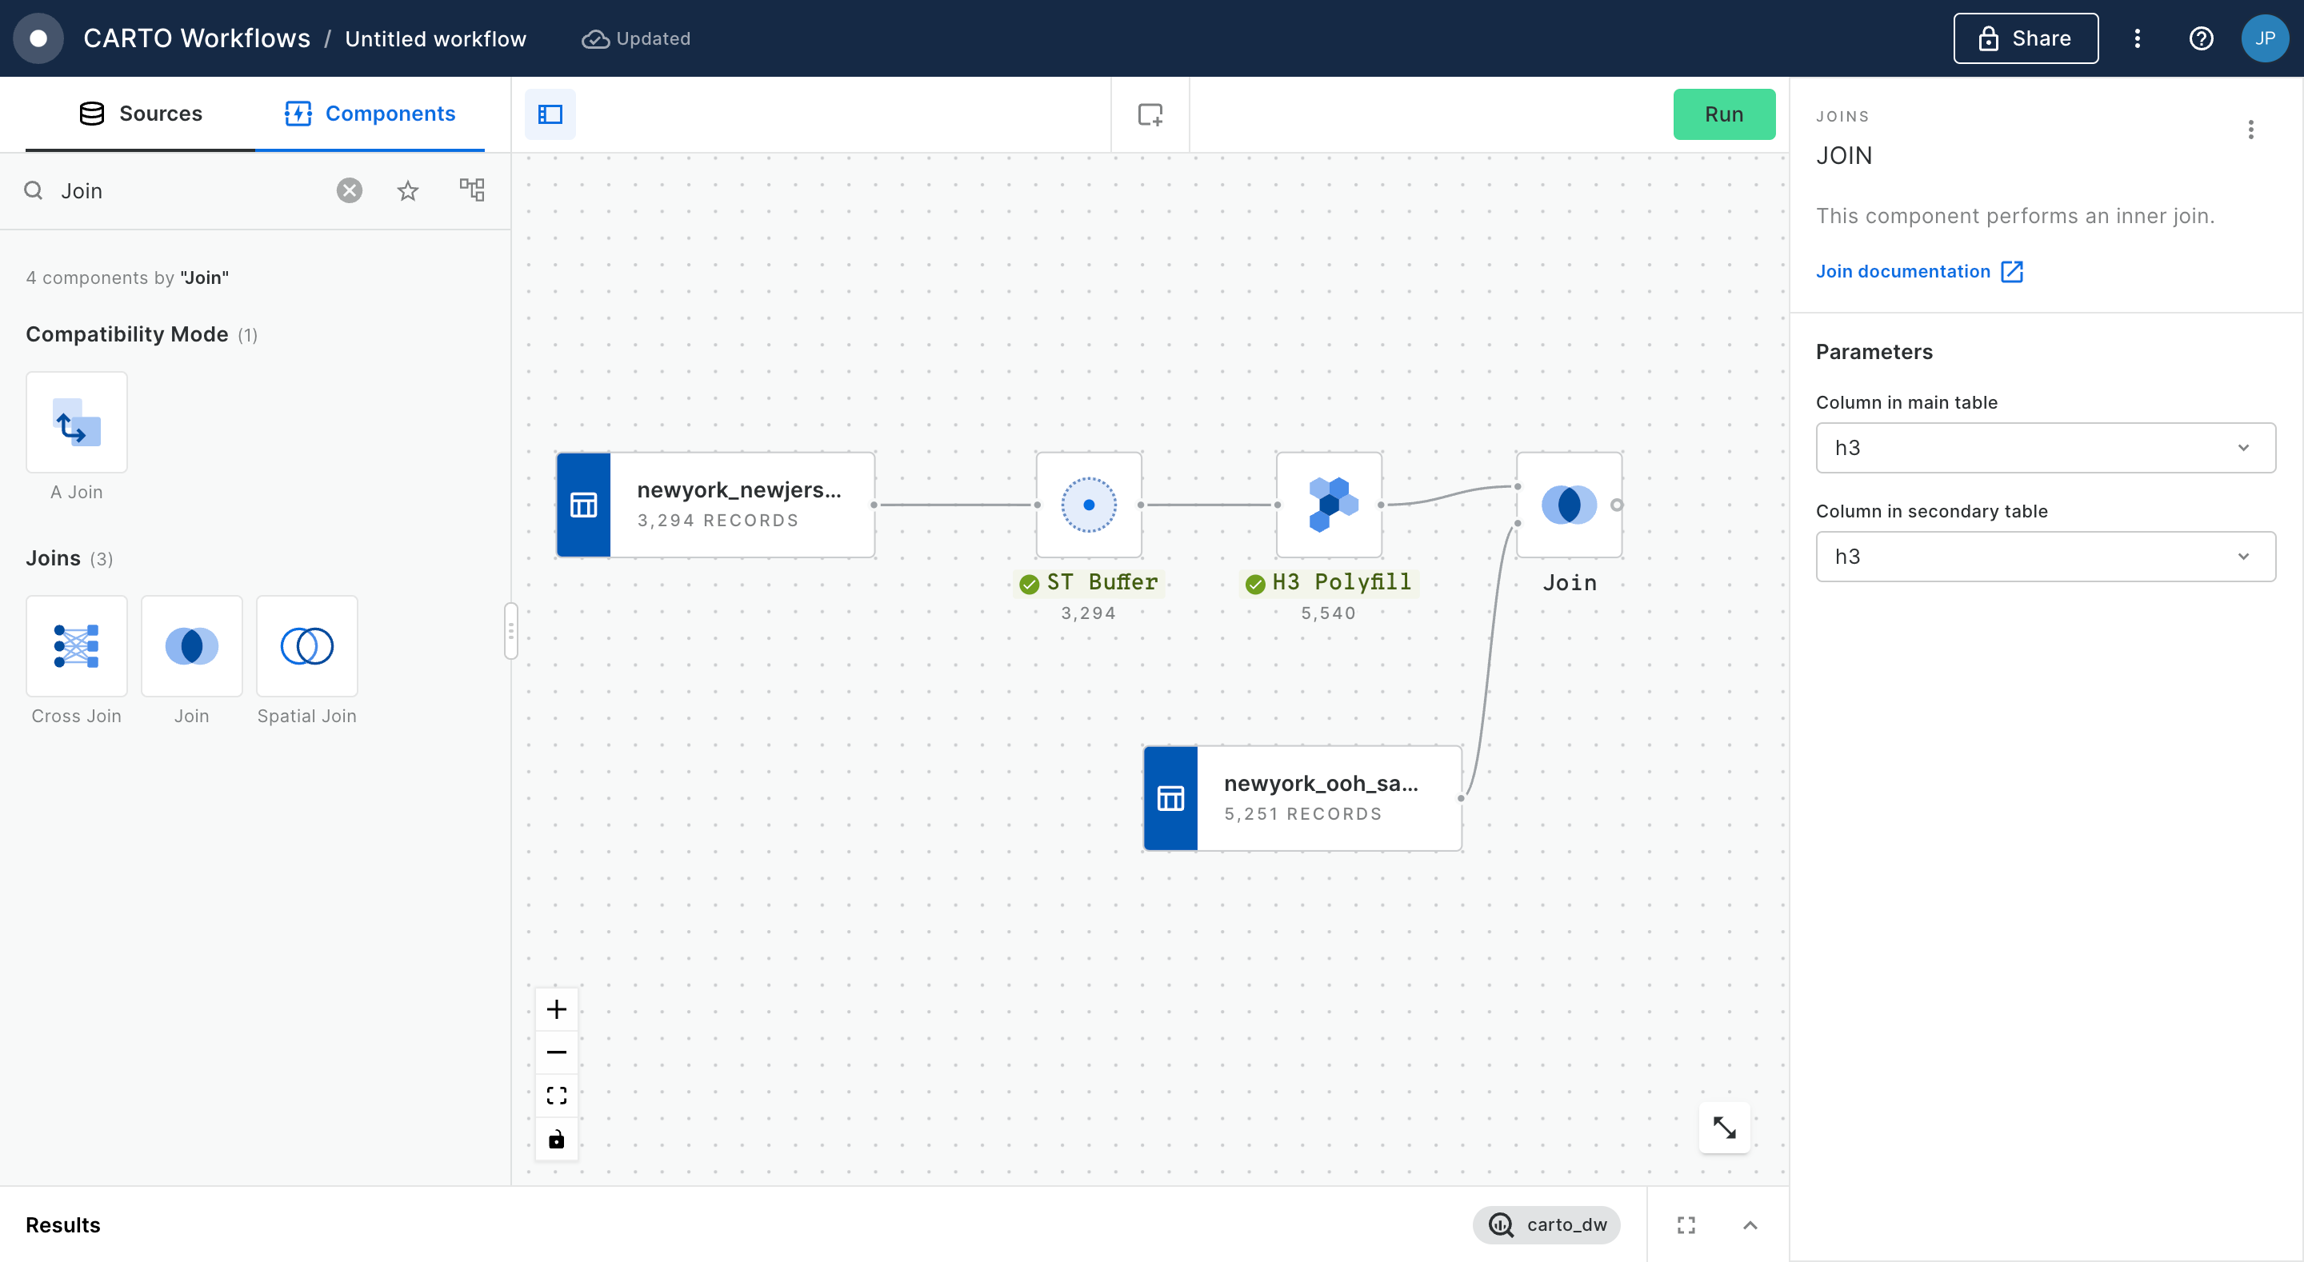
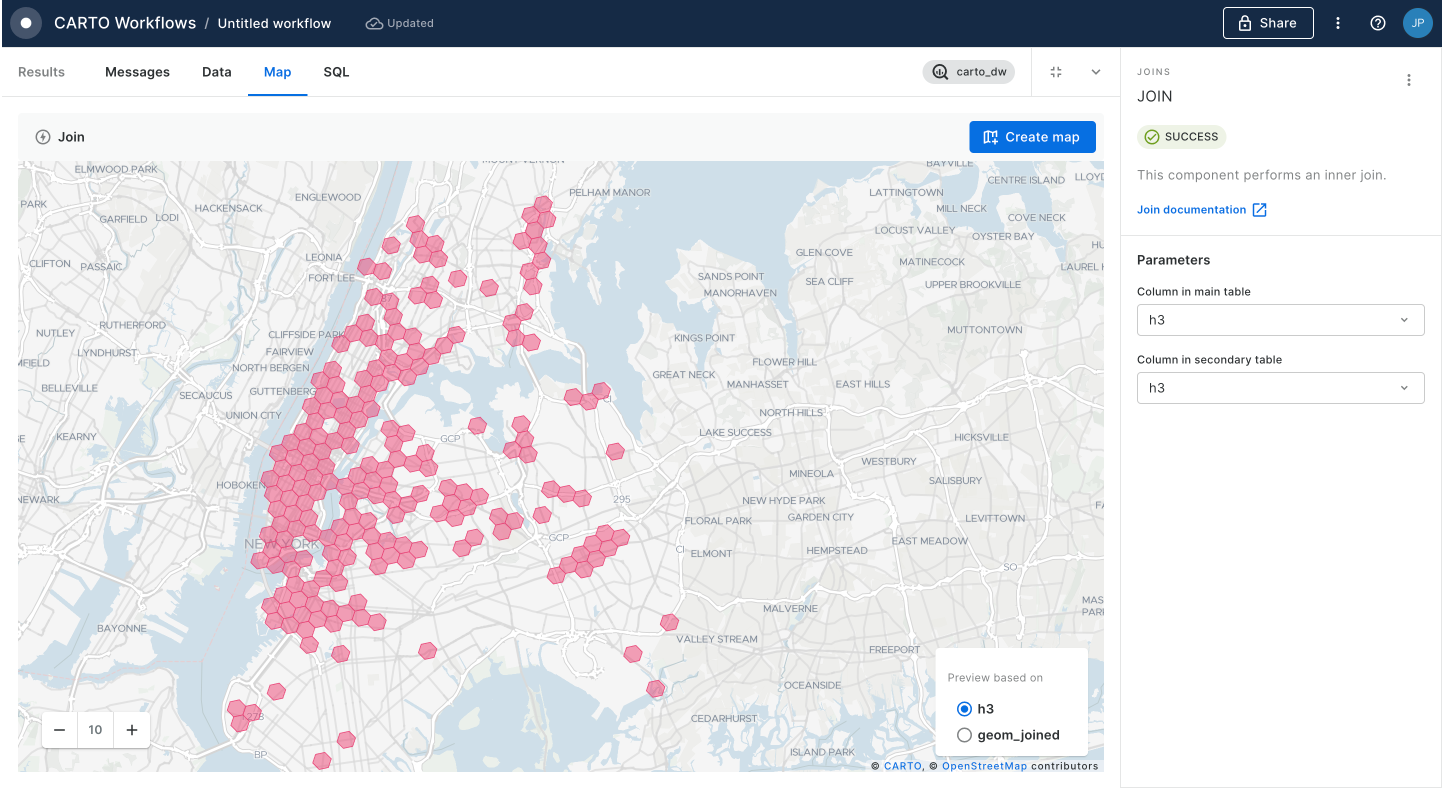
  1. We are now going to use a Join component to combine the output of the polyfill around each billboards with the audience data. We are going to select 'h3' as the column in both main and secondary tables. We click "Run".
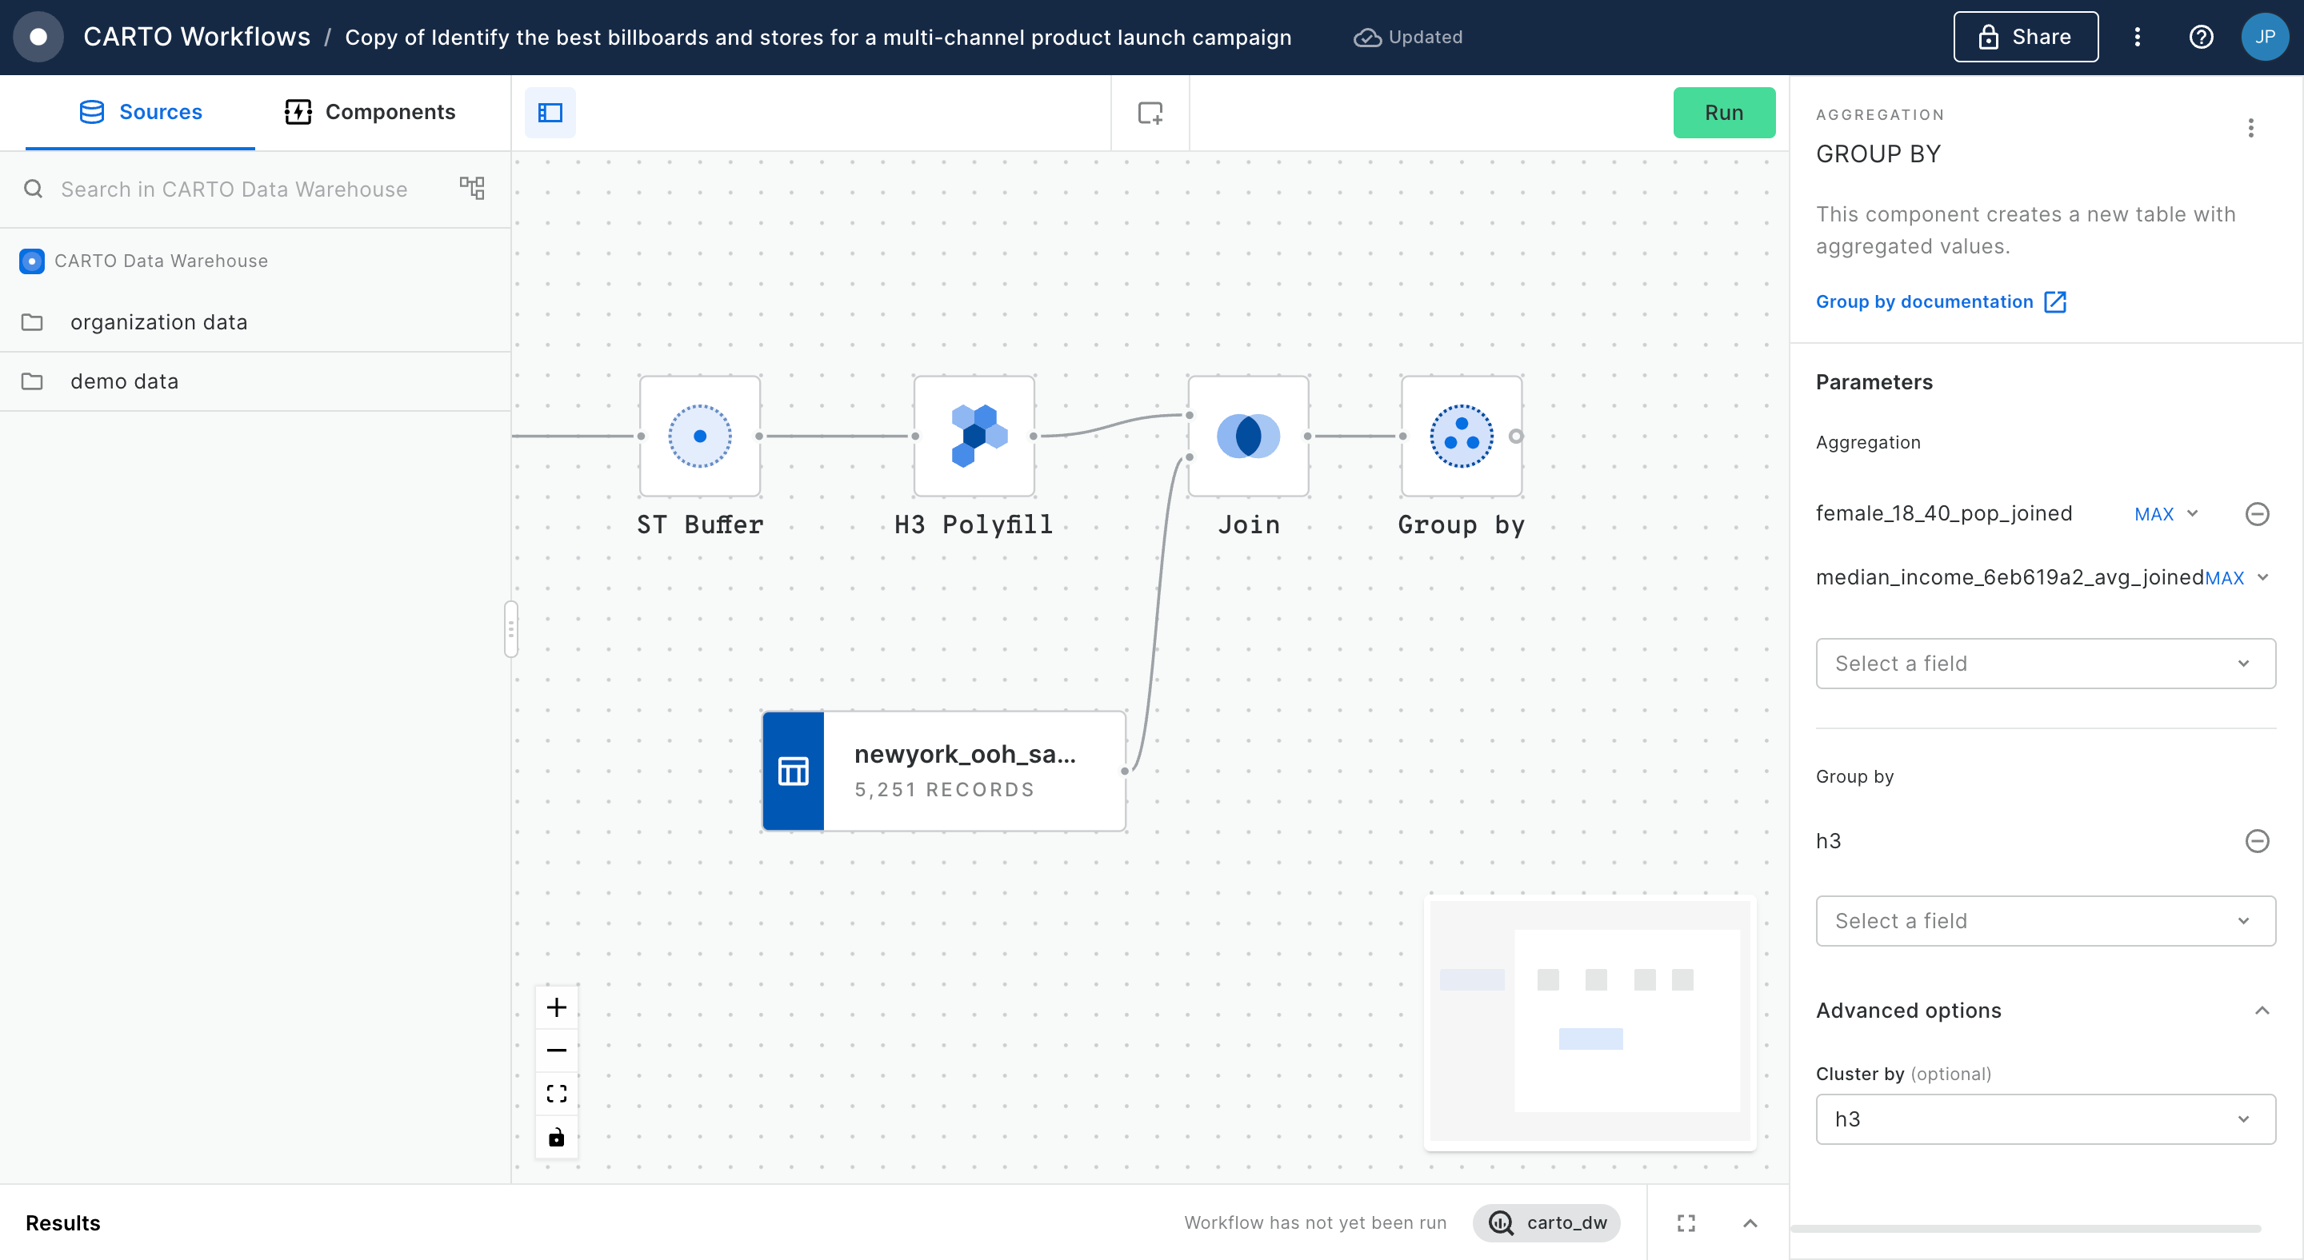
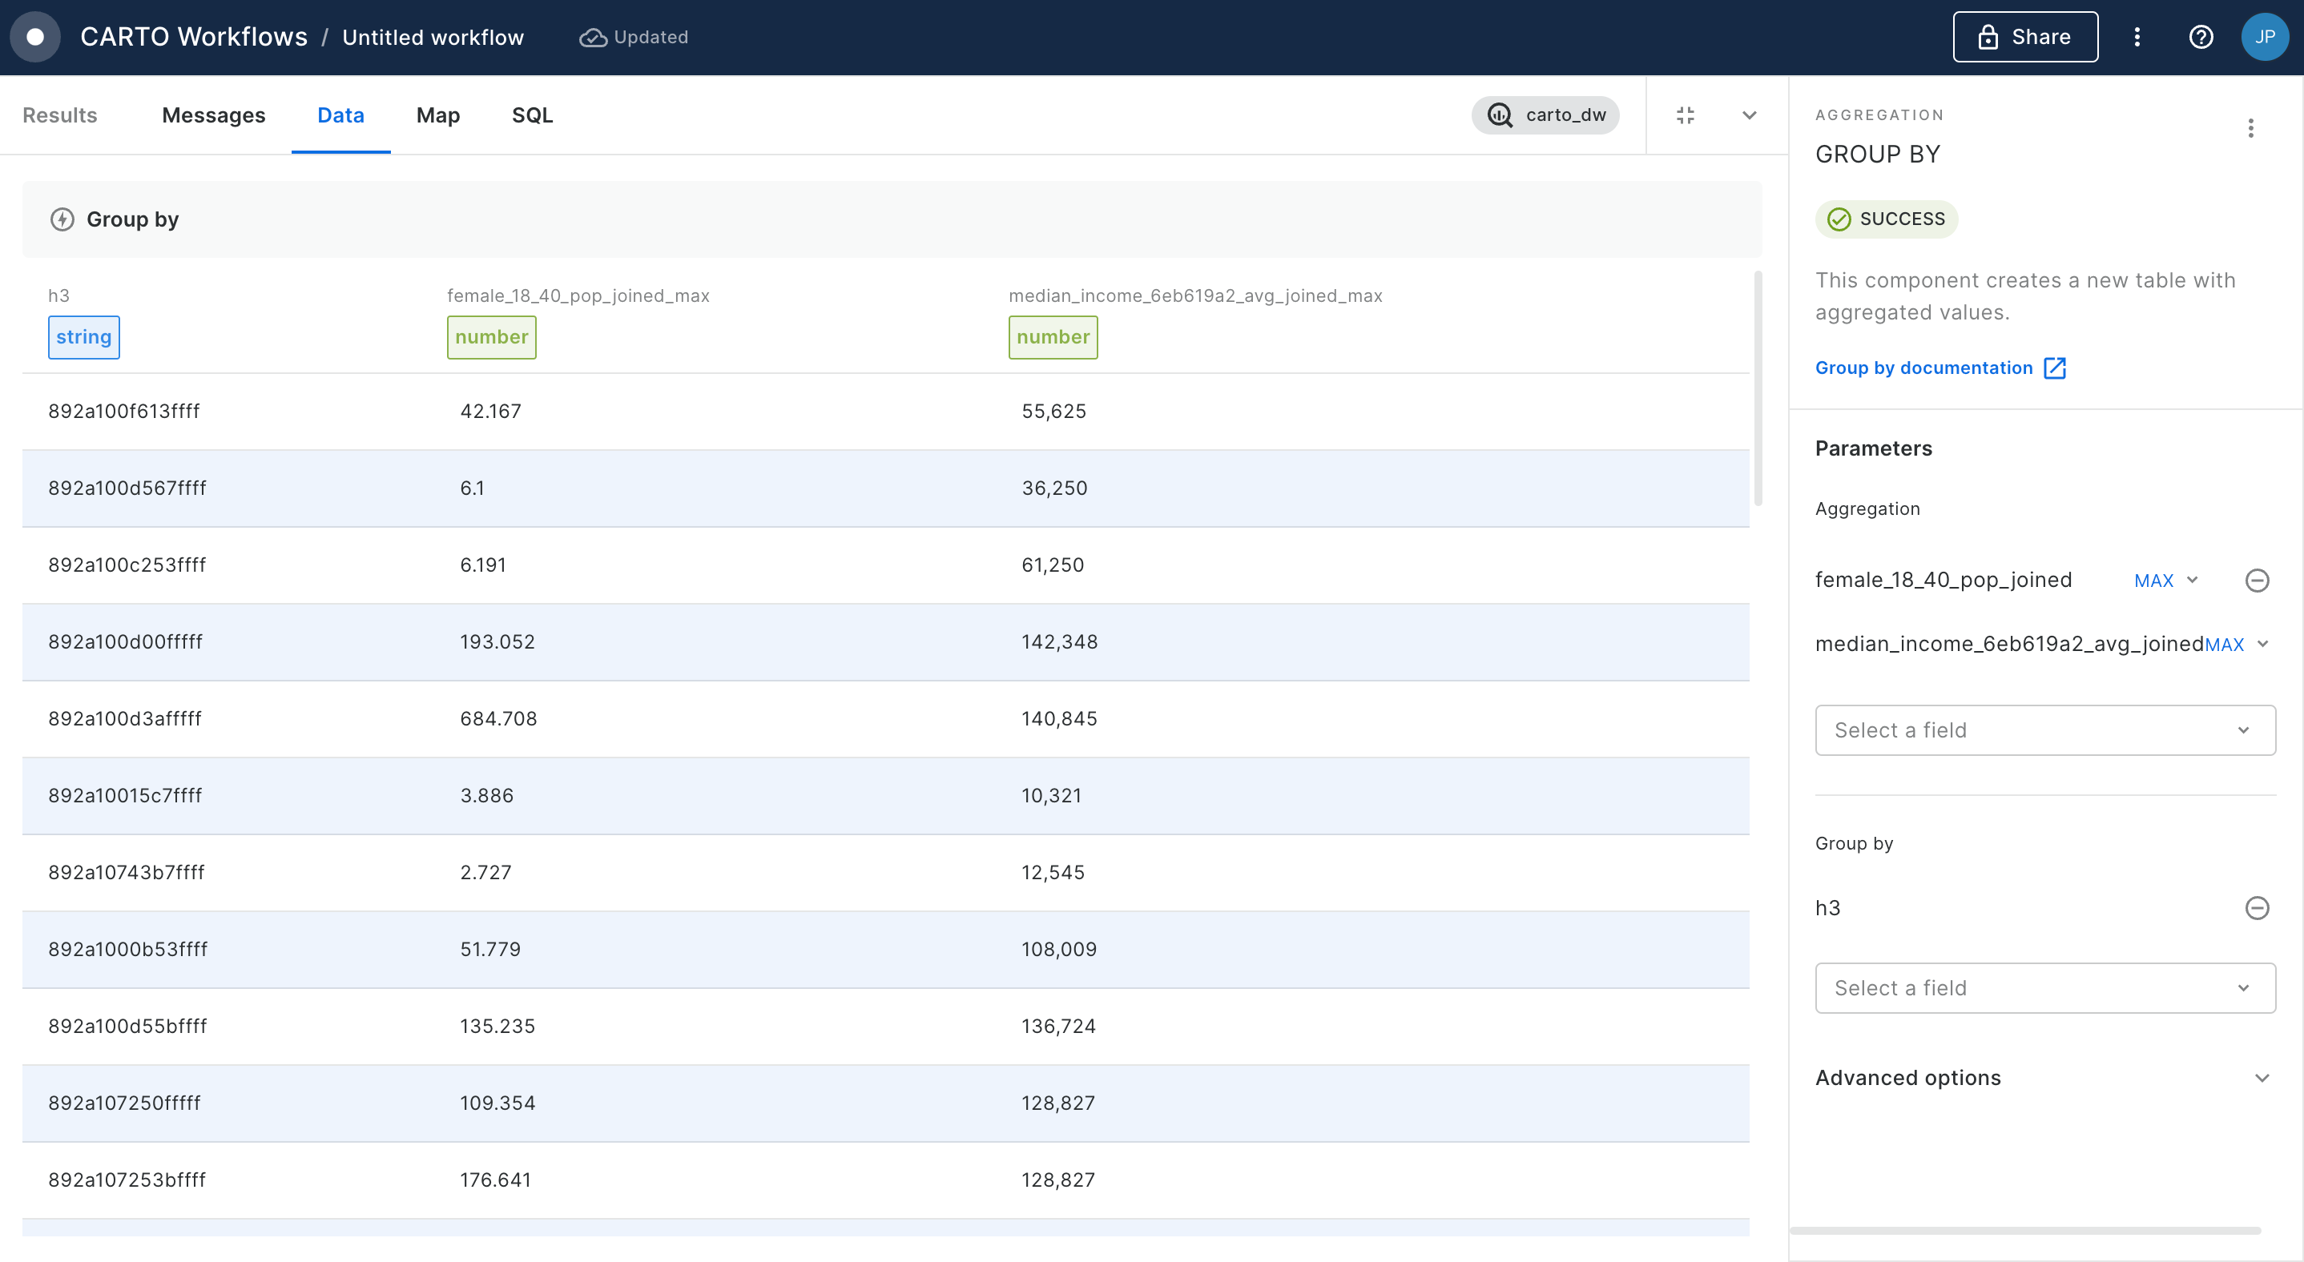
  1. Next step is to remove potentially duplicated H3 cells as the result of the Join operator (e.g. due to surrounding billboards). In order to do that we are going to add a Group by component and we are going to configure aggregations on MAX(female_18_40_pop_joined) and MAX(median_income_6eb619a2_avg_joined) and we are going to group by the column h3.
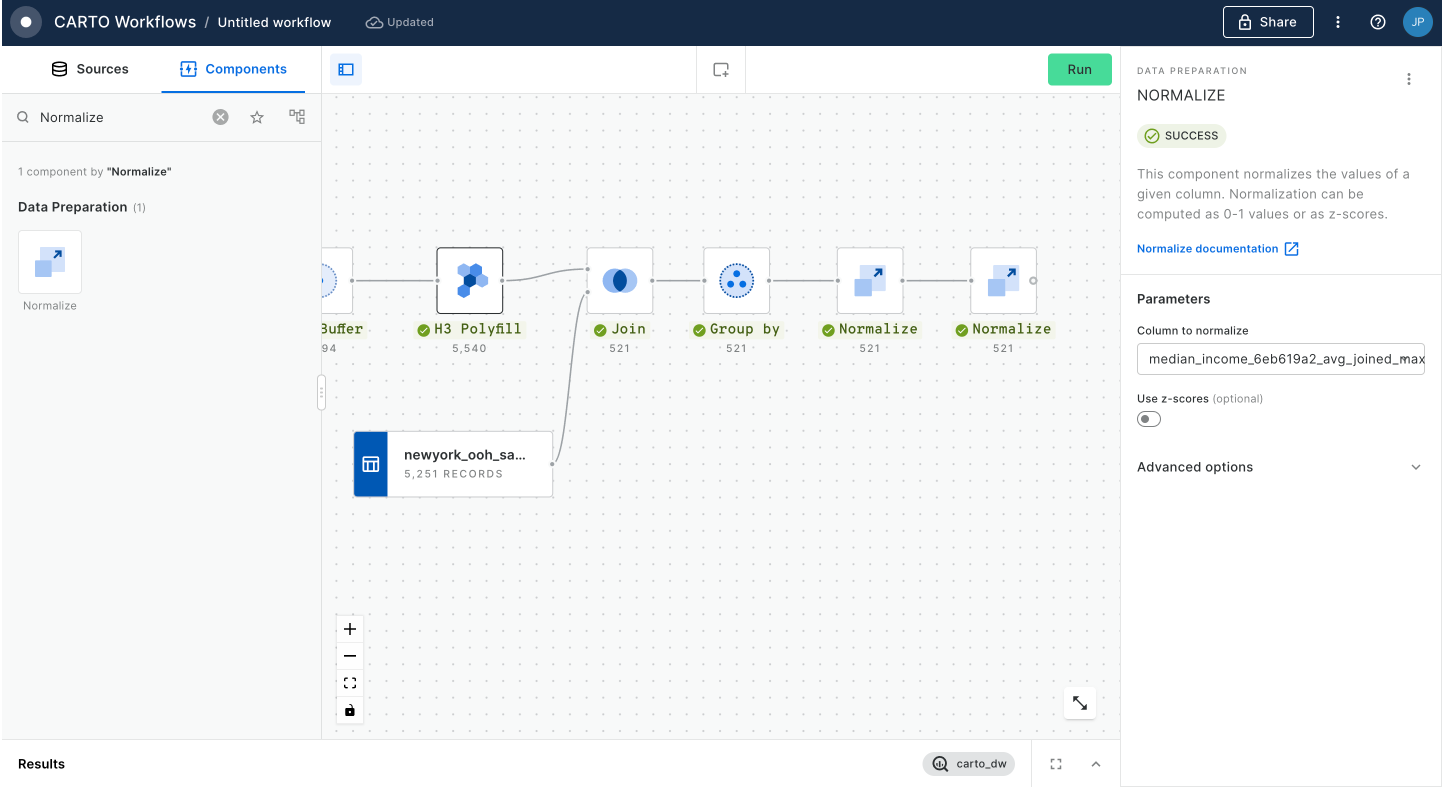
  1. In order to select the best billboard for our product what we will do first is to normalize each of the columns so to get a ratio for each of the h3 cells. For that, we are going to add the Normalize component 2 times, and we are going to normalize our data for each of the columns.
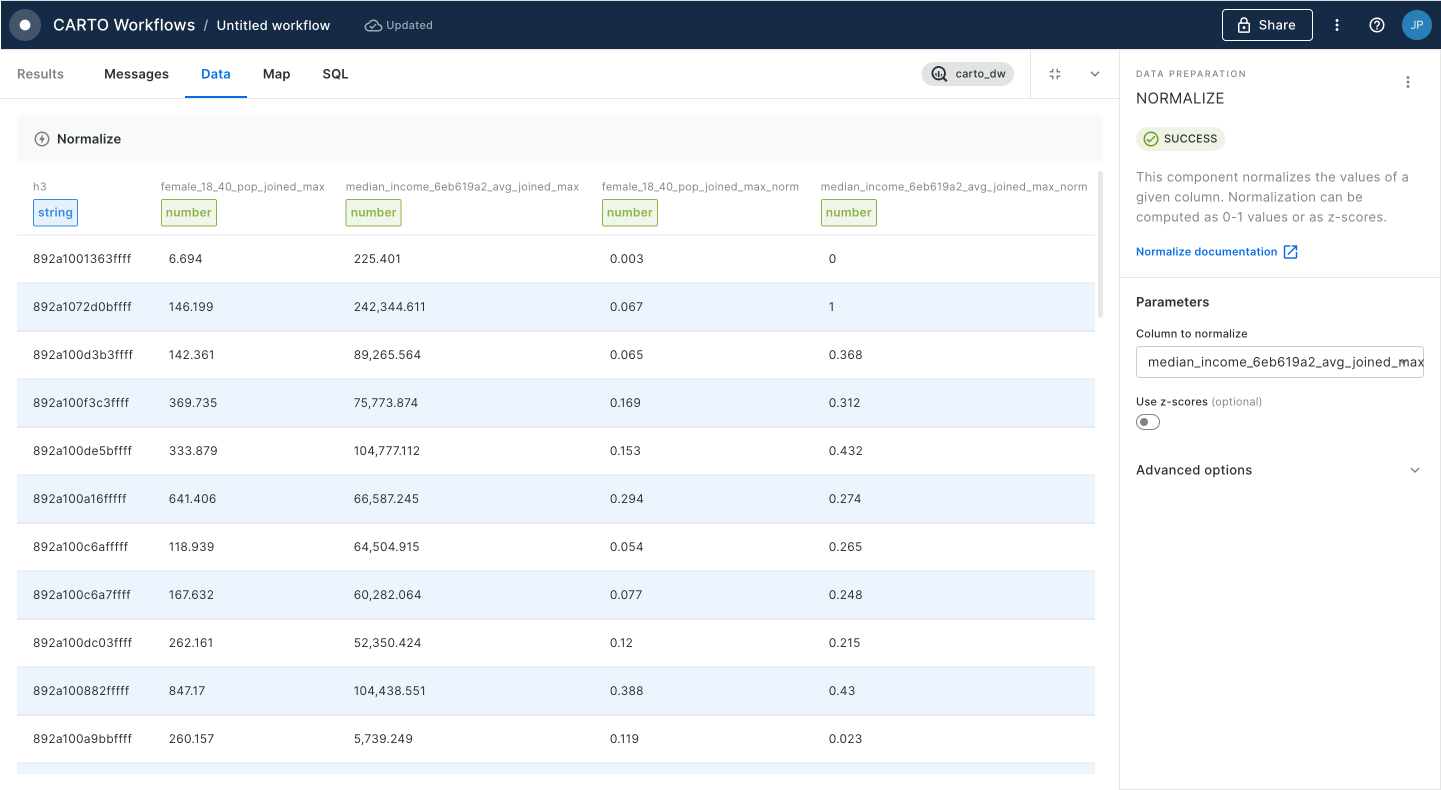
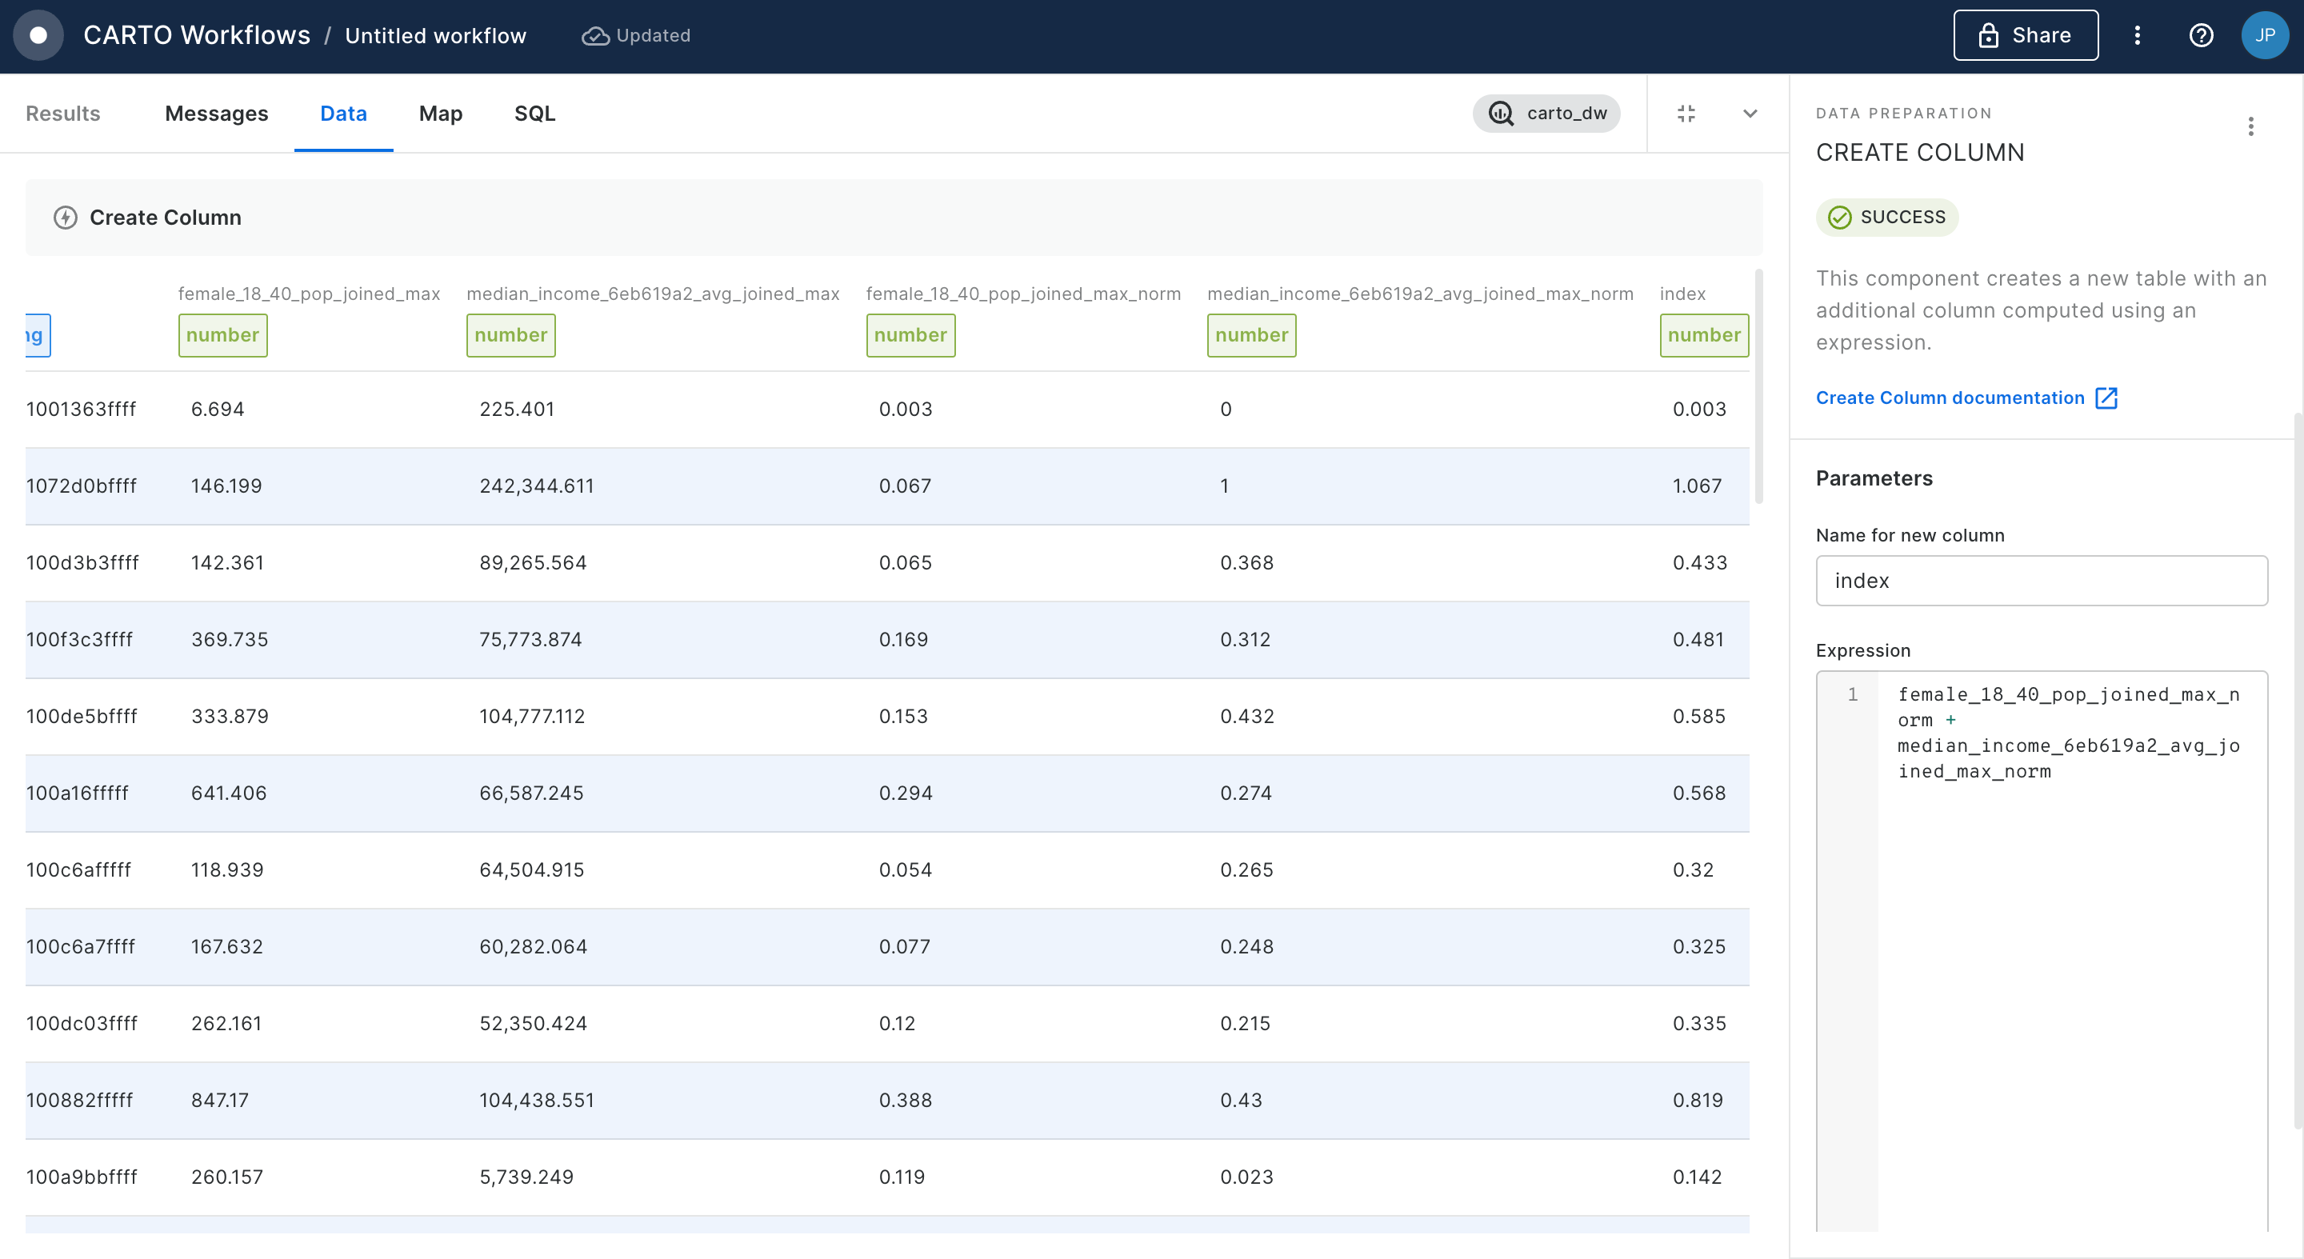
  1. Now, if you check our last output table we have 2 new columns with the result of the normalization: female_18_40_pop_joined_max_norm and median_income_6eb619a2_avg_joined_max_norm.
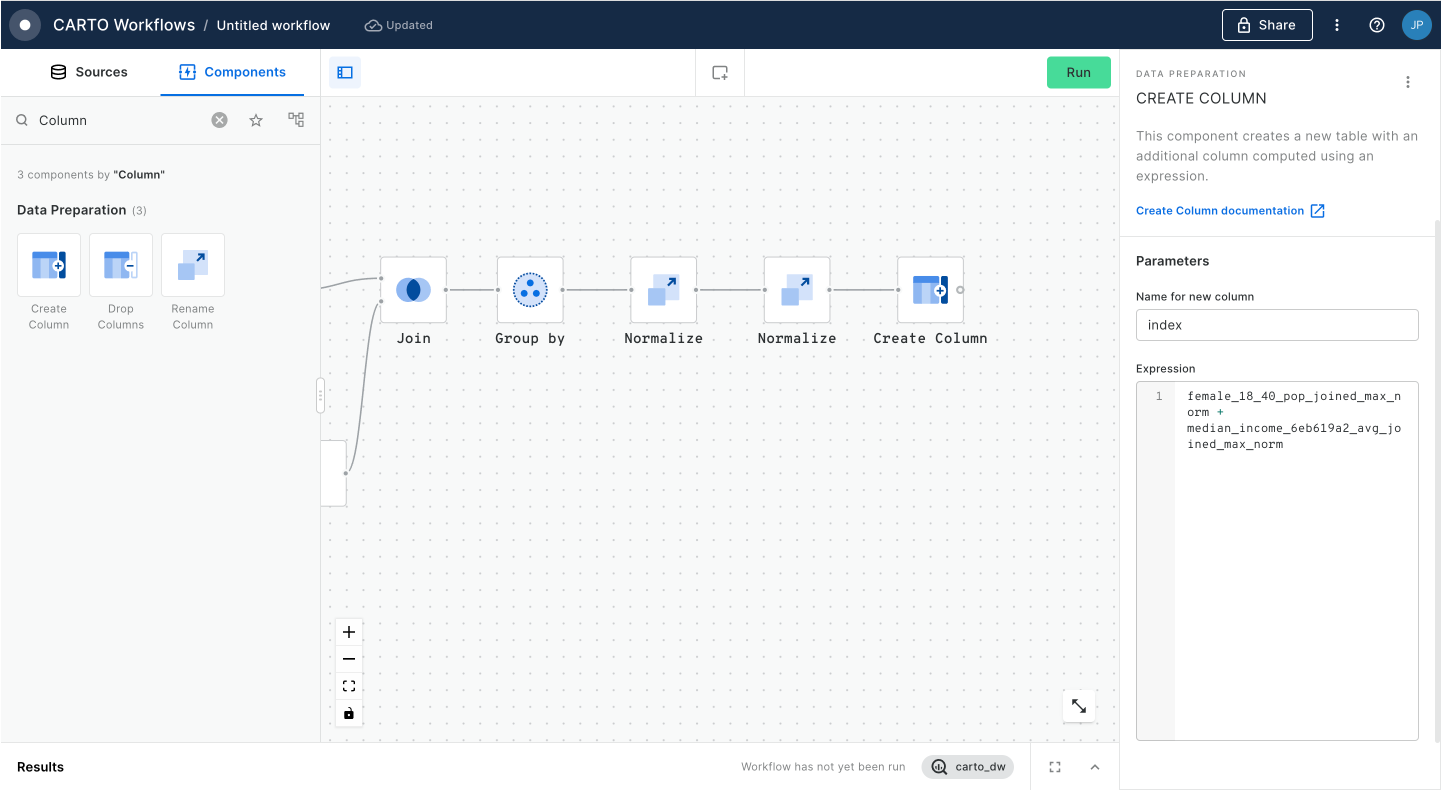
  1. In the next step we are going to create a New Column in the table with a custom expression; we are going to add the result of the normalization in the 2 columns in order to have a single indicator of the relevance of each H3 cell for our target audience. We are going to call the new column 'index' and the expression will be: female_18_40_pop_joined_max_norm + median_income_6eb619a2_avg_joined_max_norm.
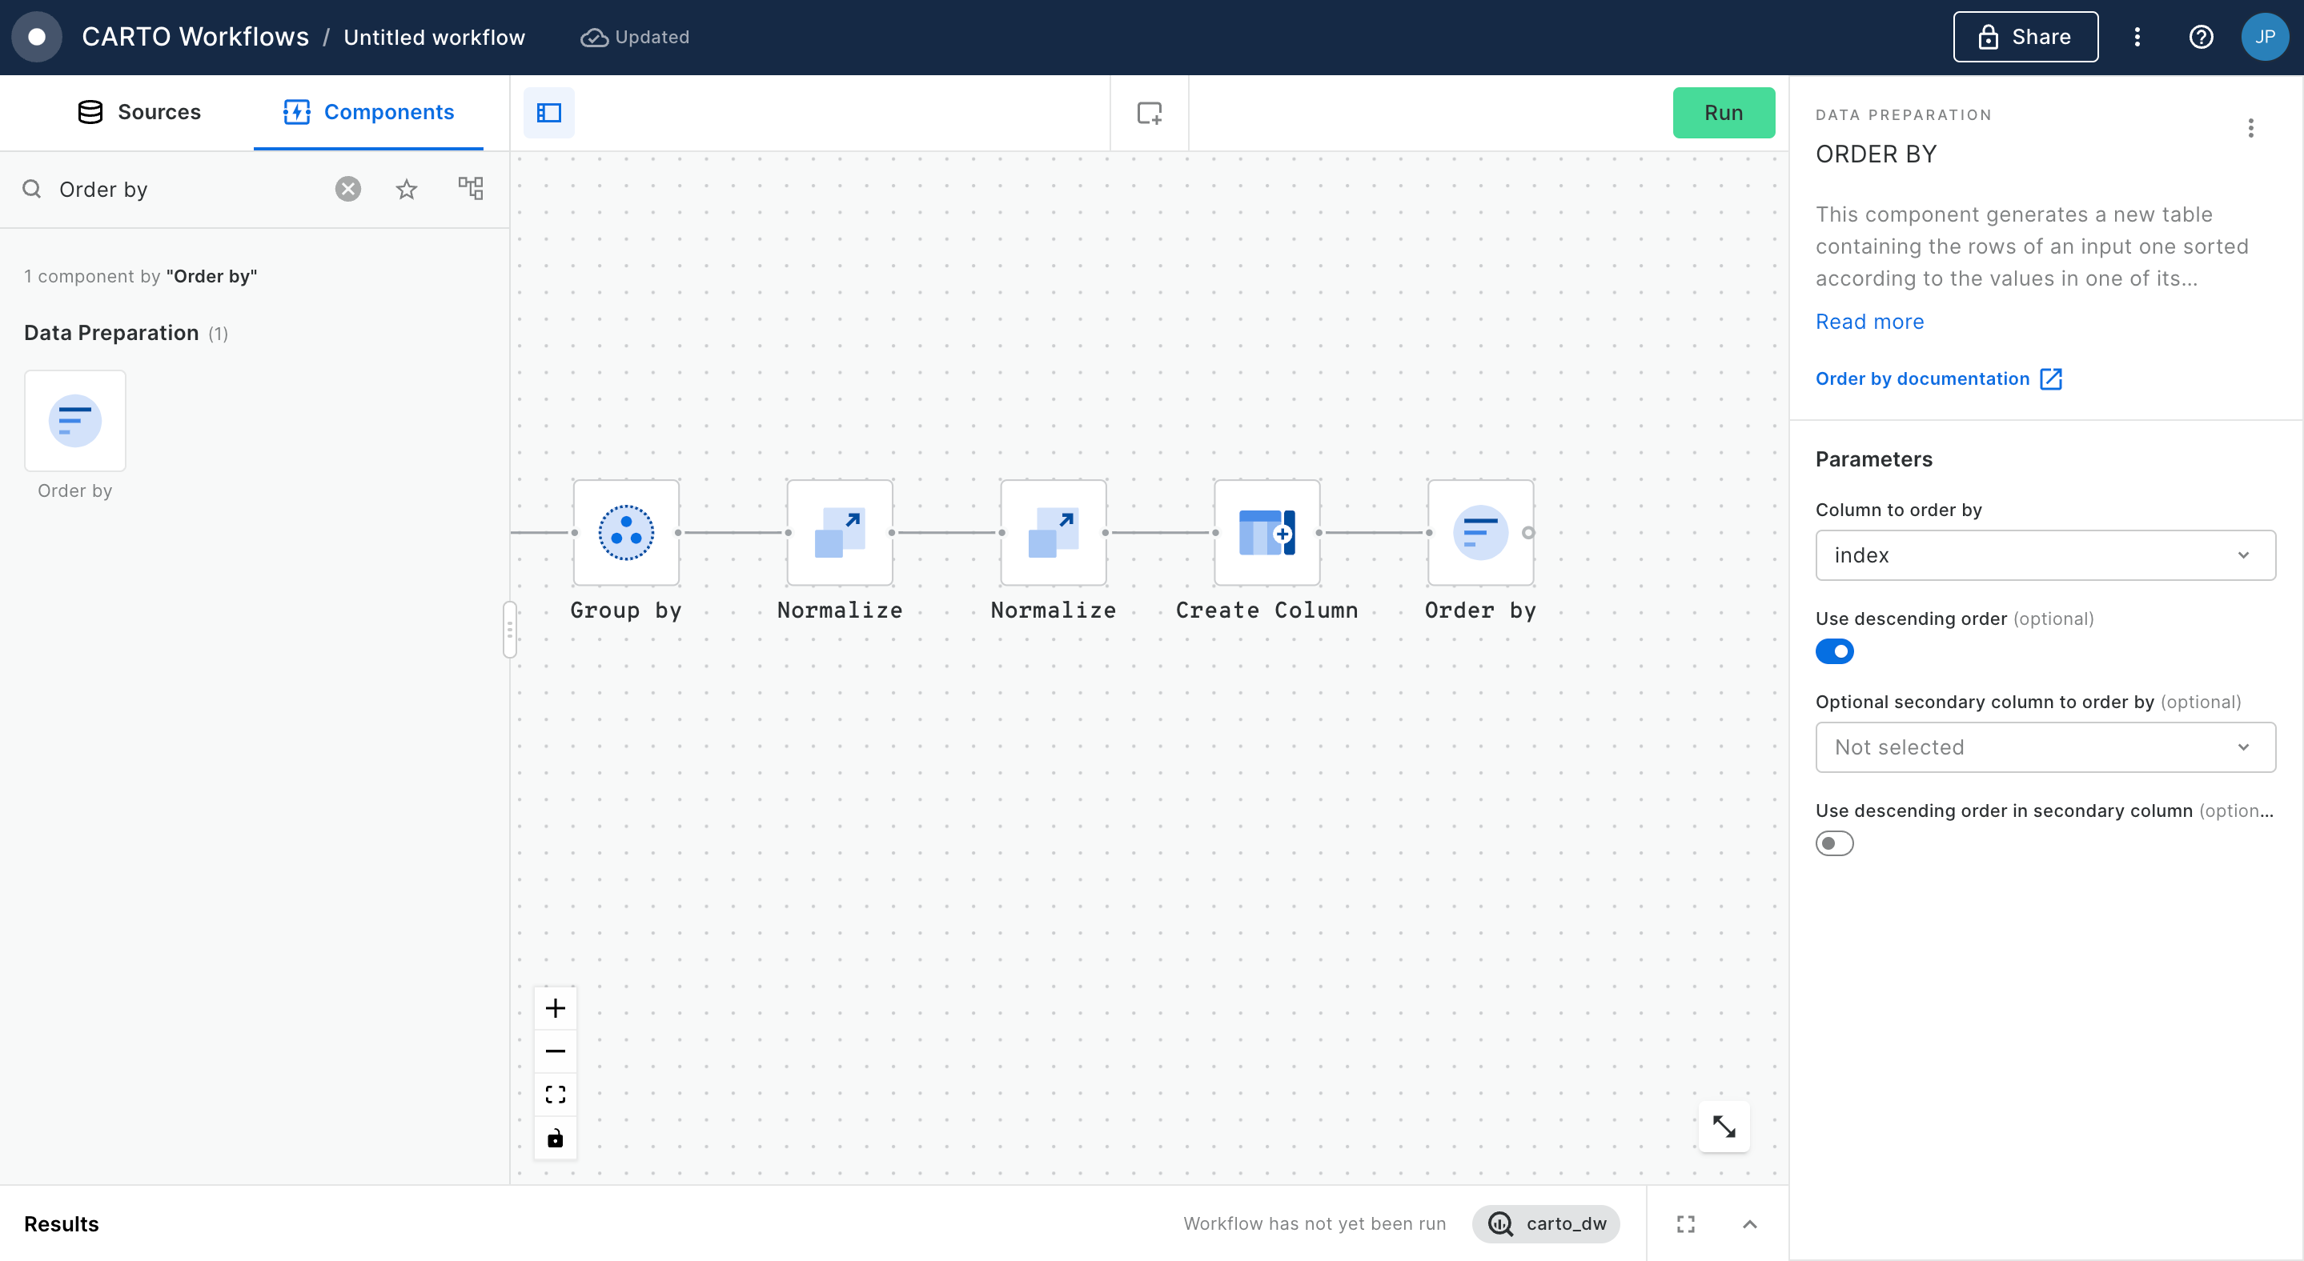
  1. In order to keep the best areas for our out-of-home advertising campaign we are going to add an Order by component and connect the table with the new column. We are going to order our table based on the 'index' column and in 'Descending' order.
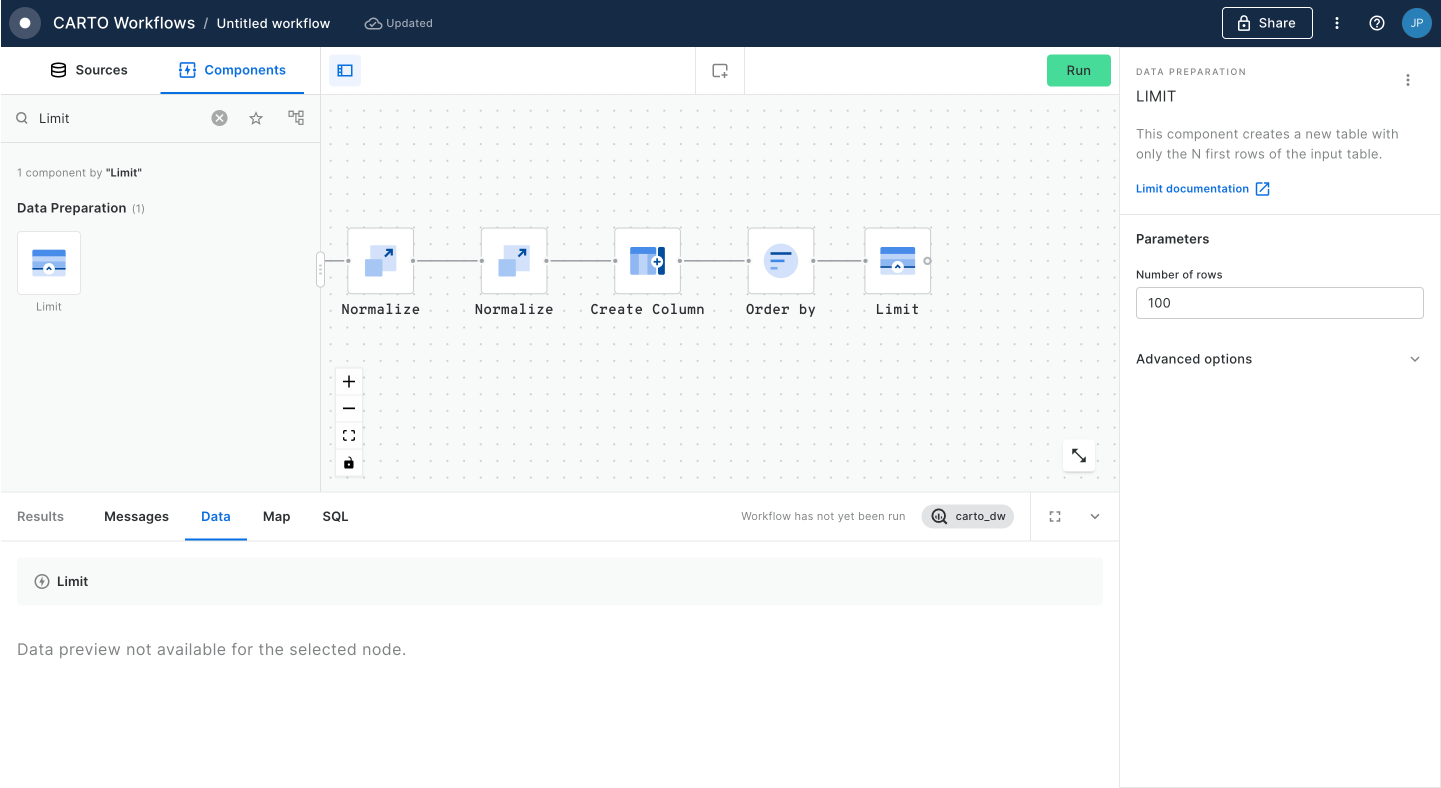
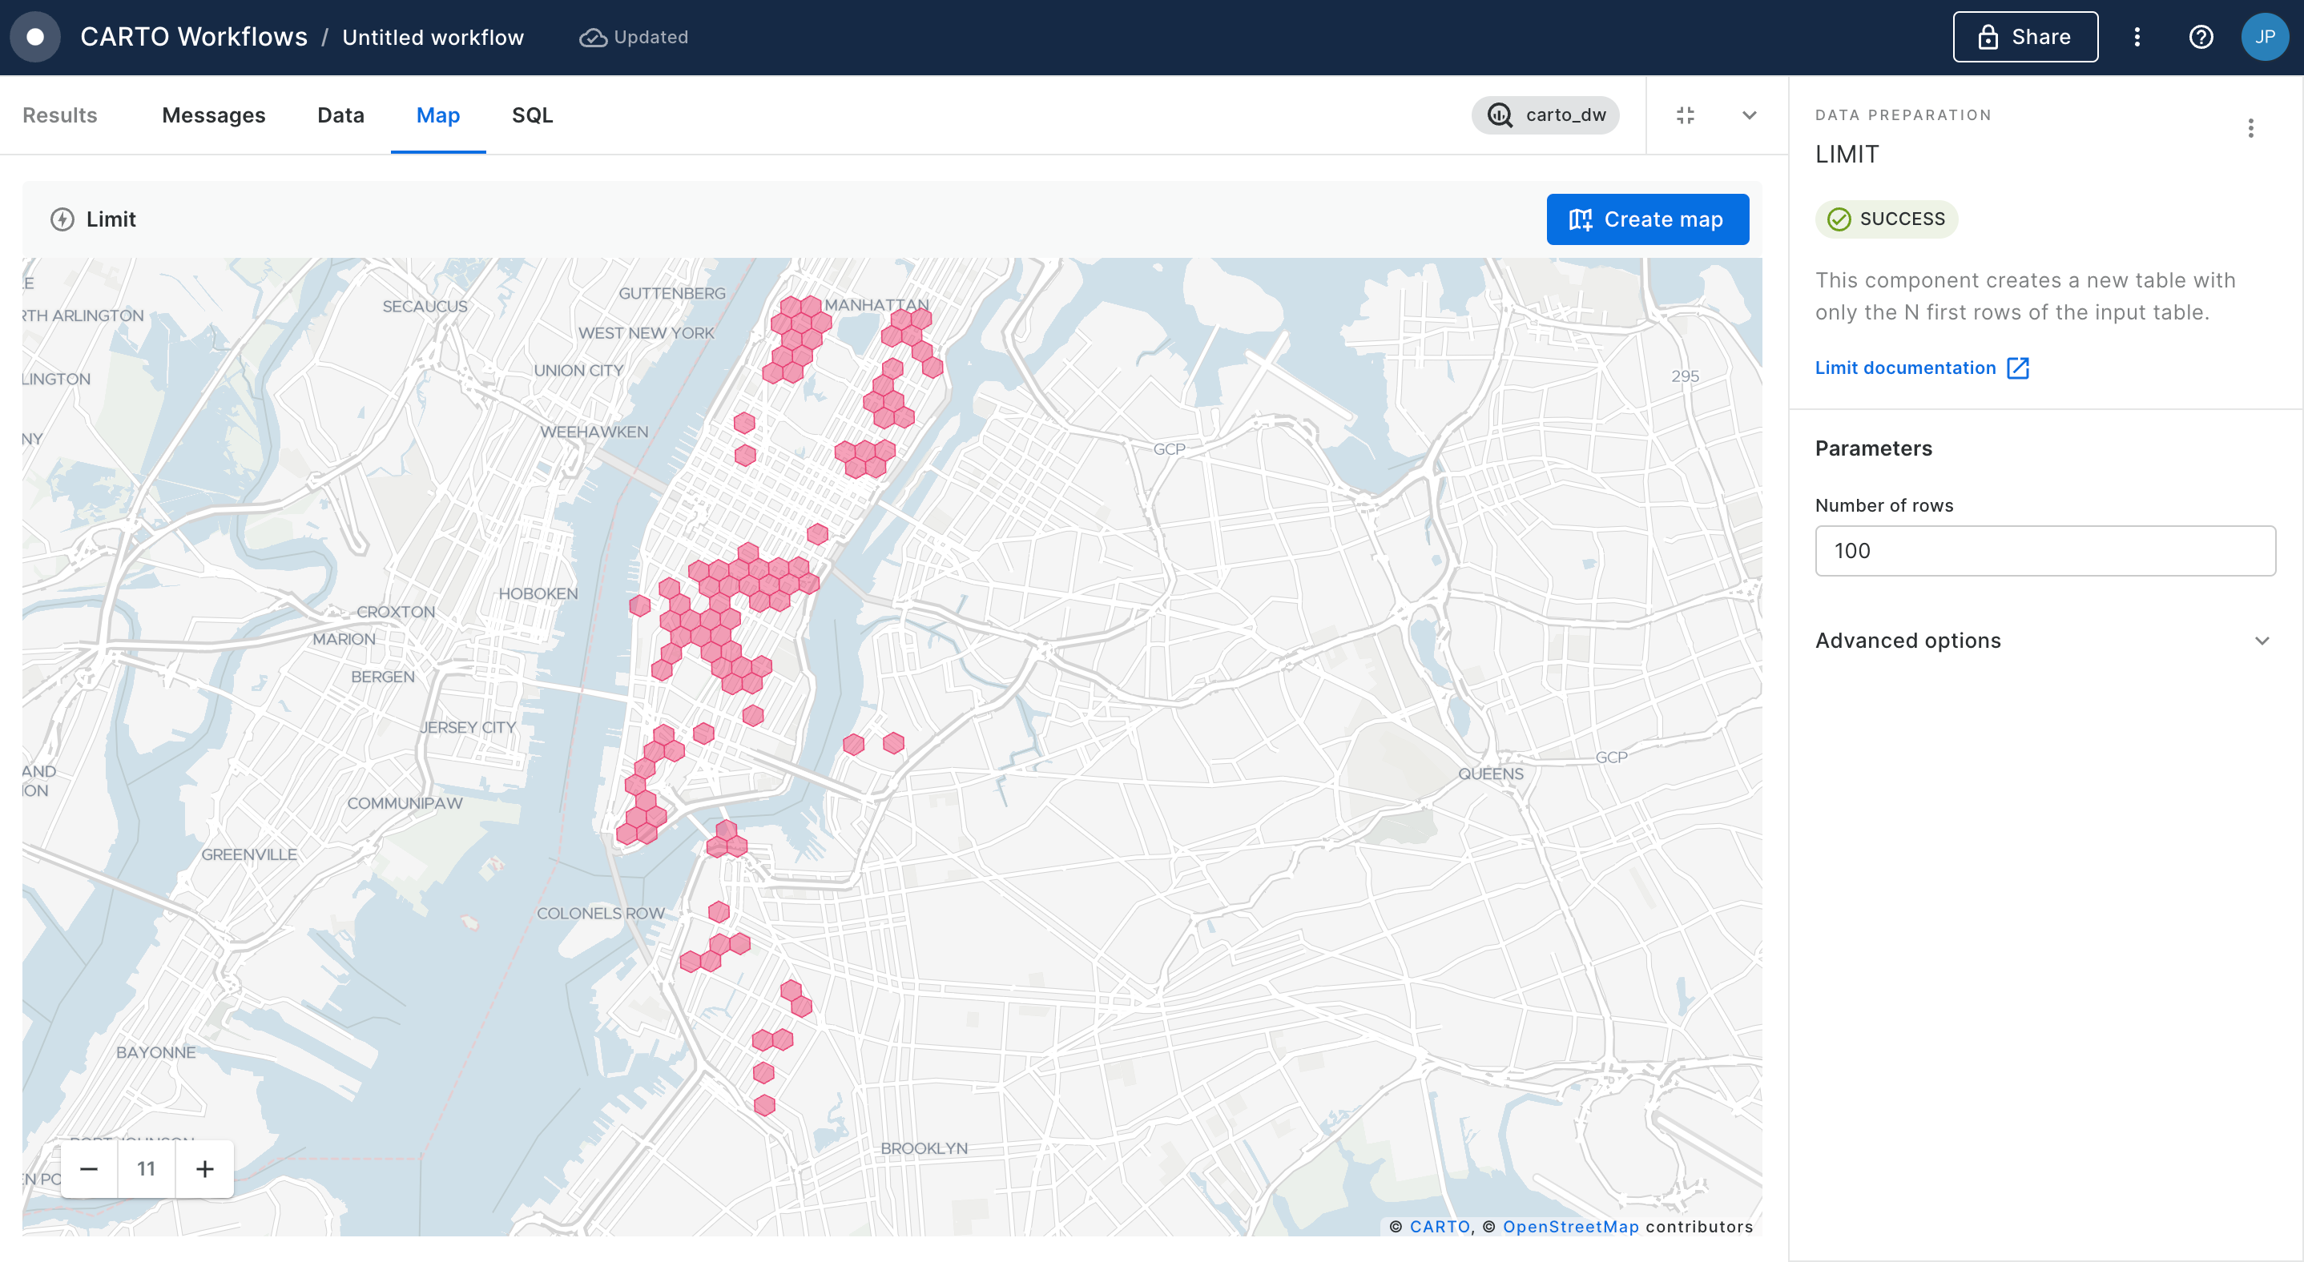
  1. To keep the 100 best areas, we are going to add a Limit component and select '100' as the number of rows.
Now, at this step, what we have accomplished is to have the best areas (represented as H3 cells) surrounding existing OOH billboards in order to push our advertising campaign. Next step is to complete this analysis by also identifying what are the best retail stores in those same areas in order for us to complement our OOH campaign with in-store activities such as promotions, samples, etc.
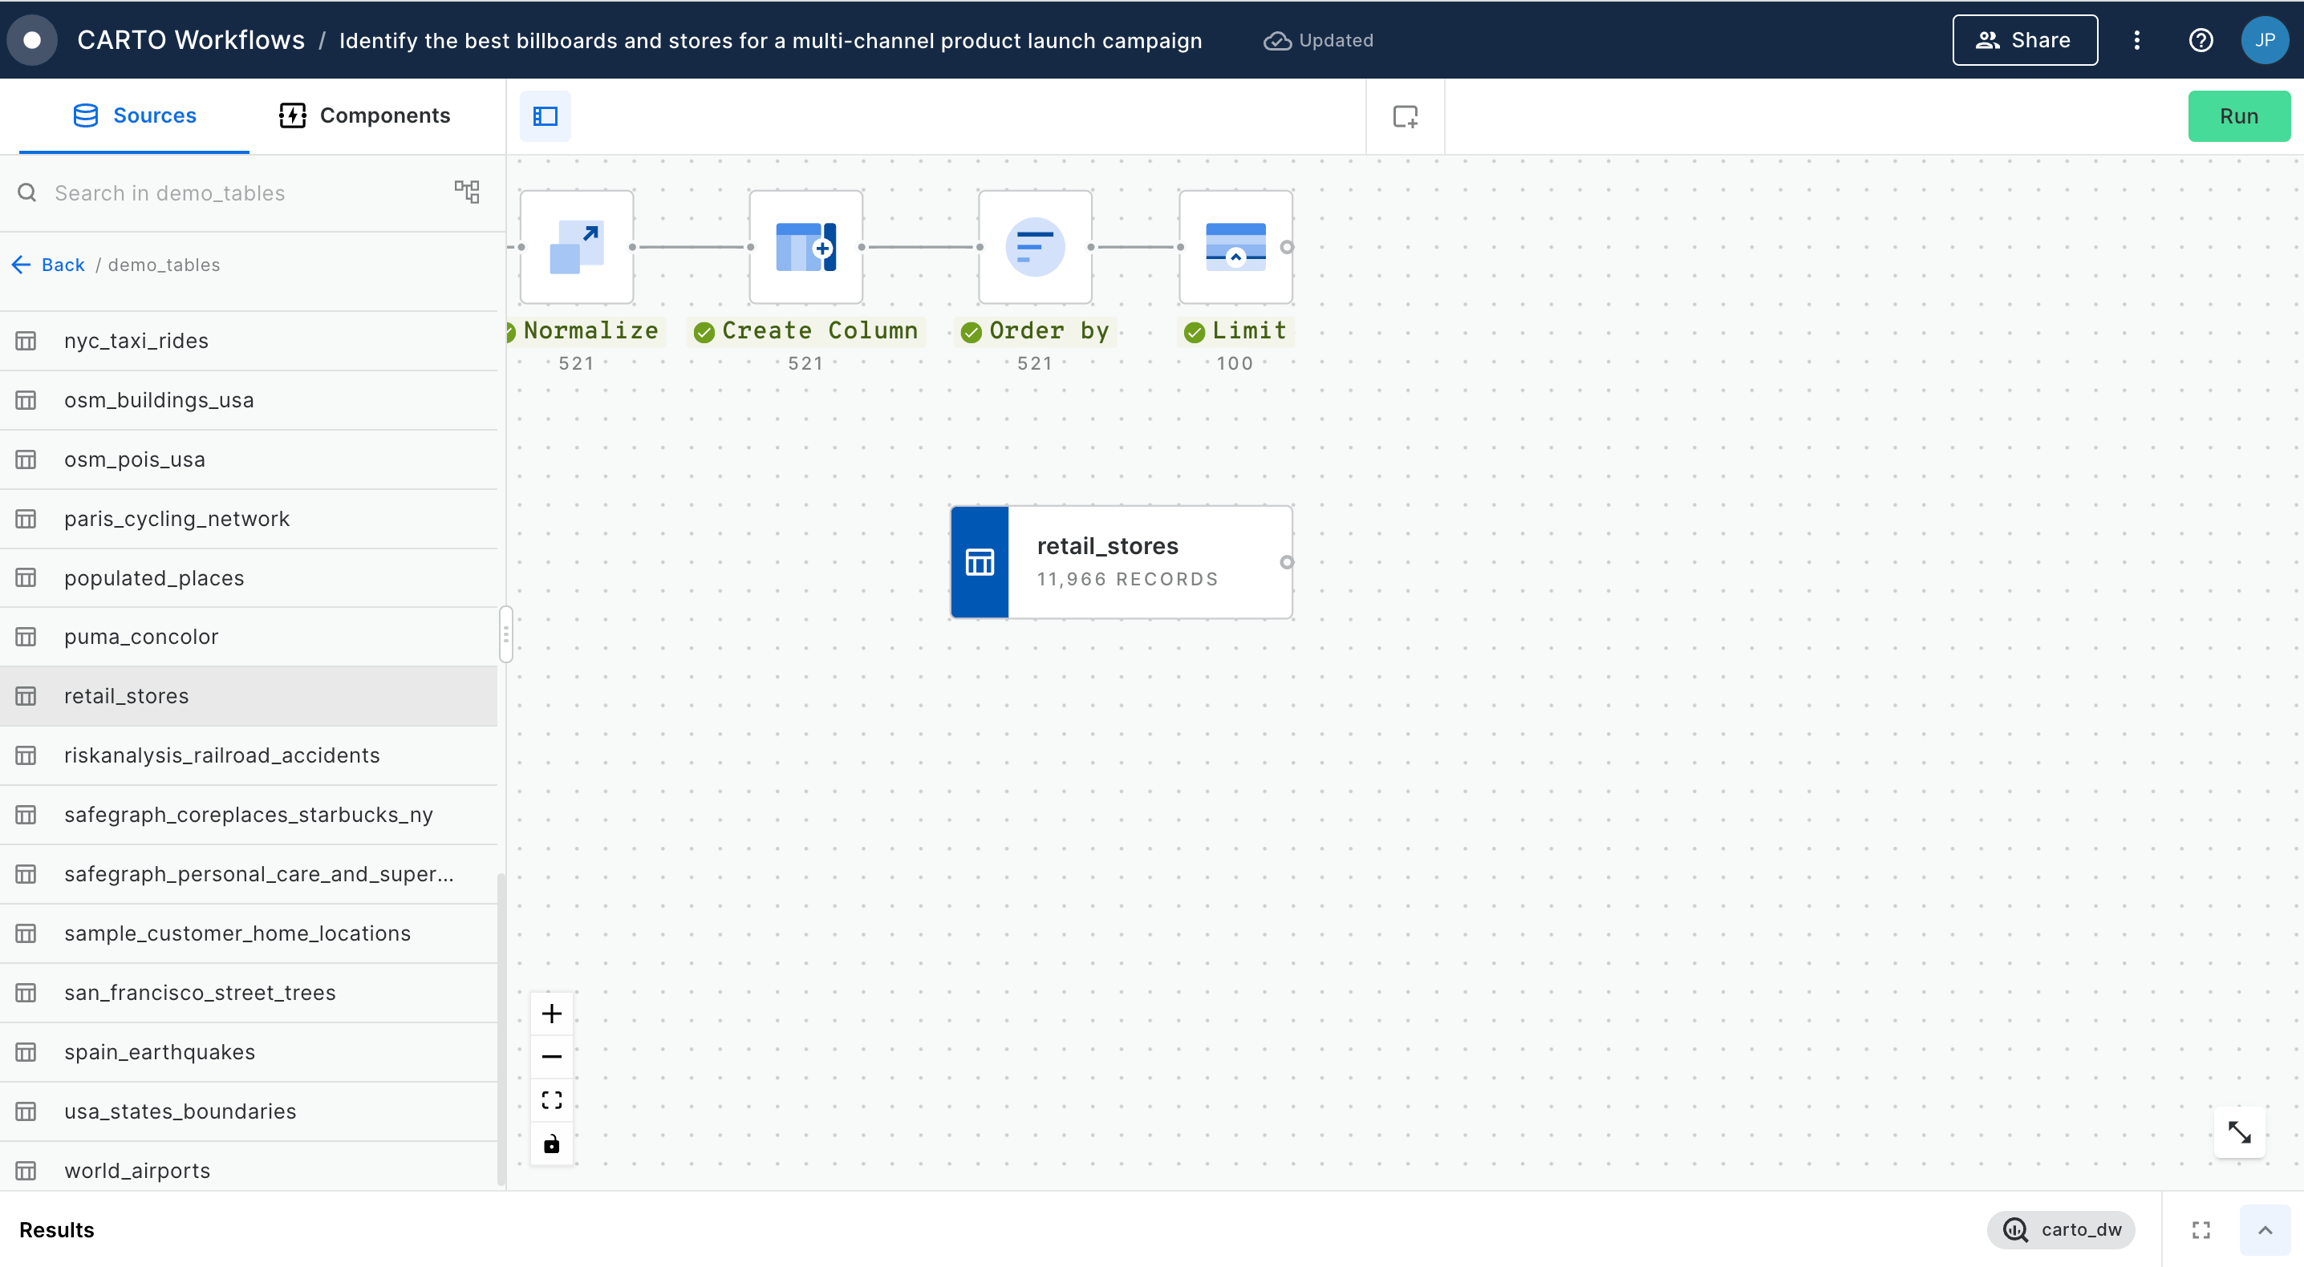
  1. Next, we are going to add a new data source to our workflow. We select the retail_stores table from 'demo data' and we drop it into the canvas.
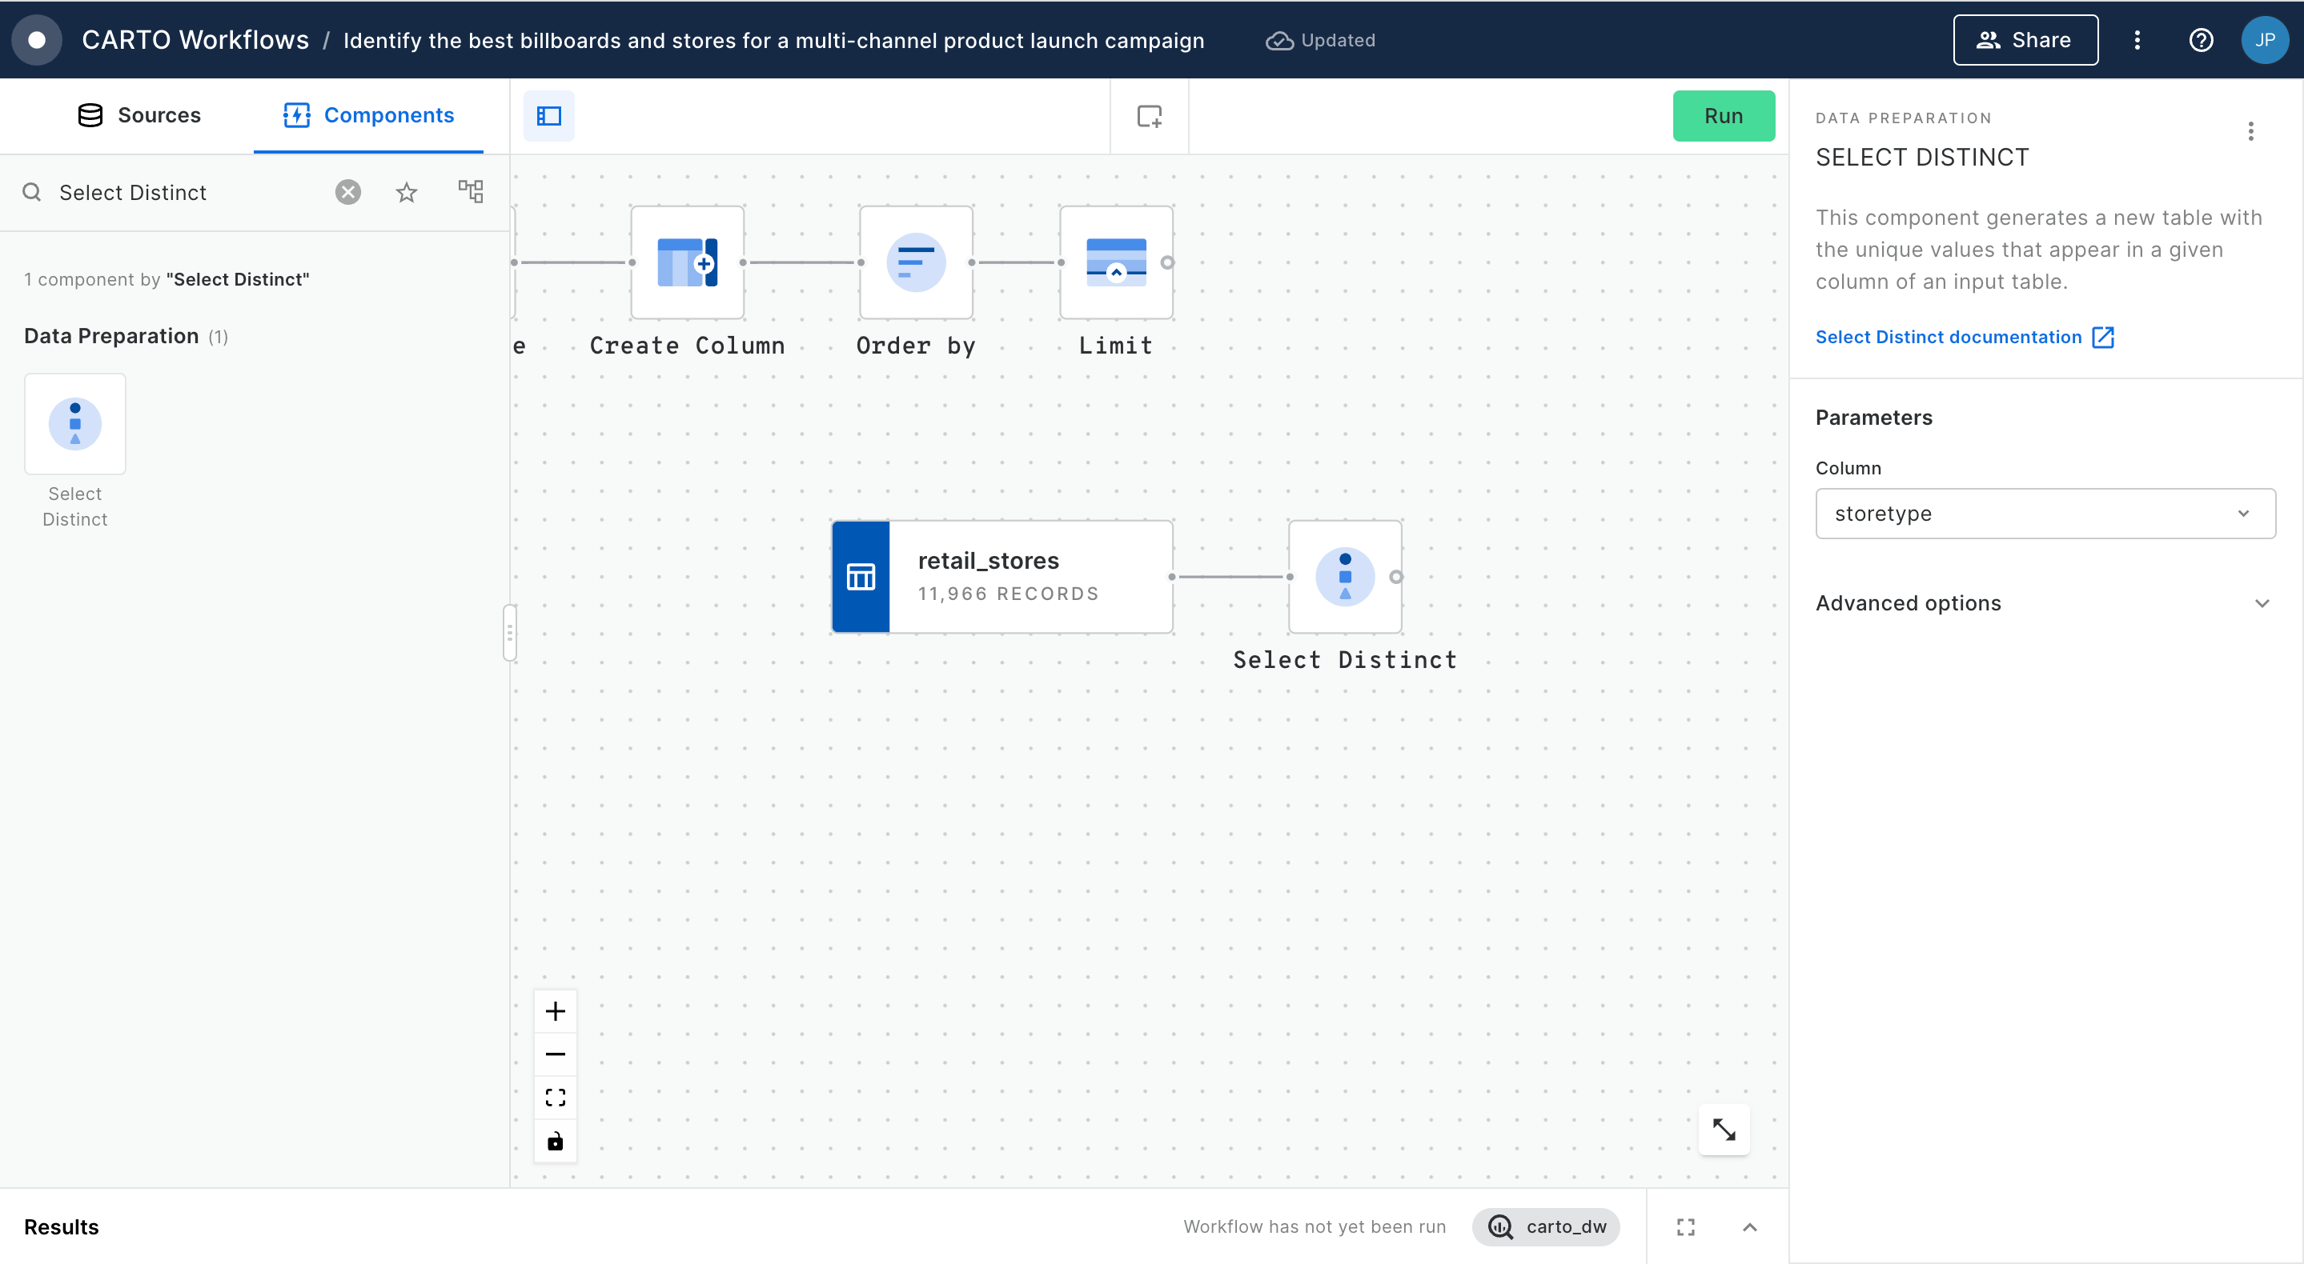
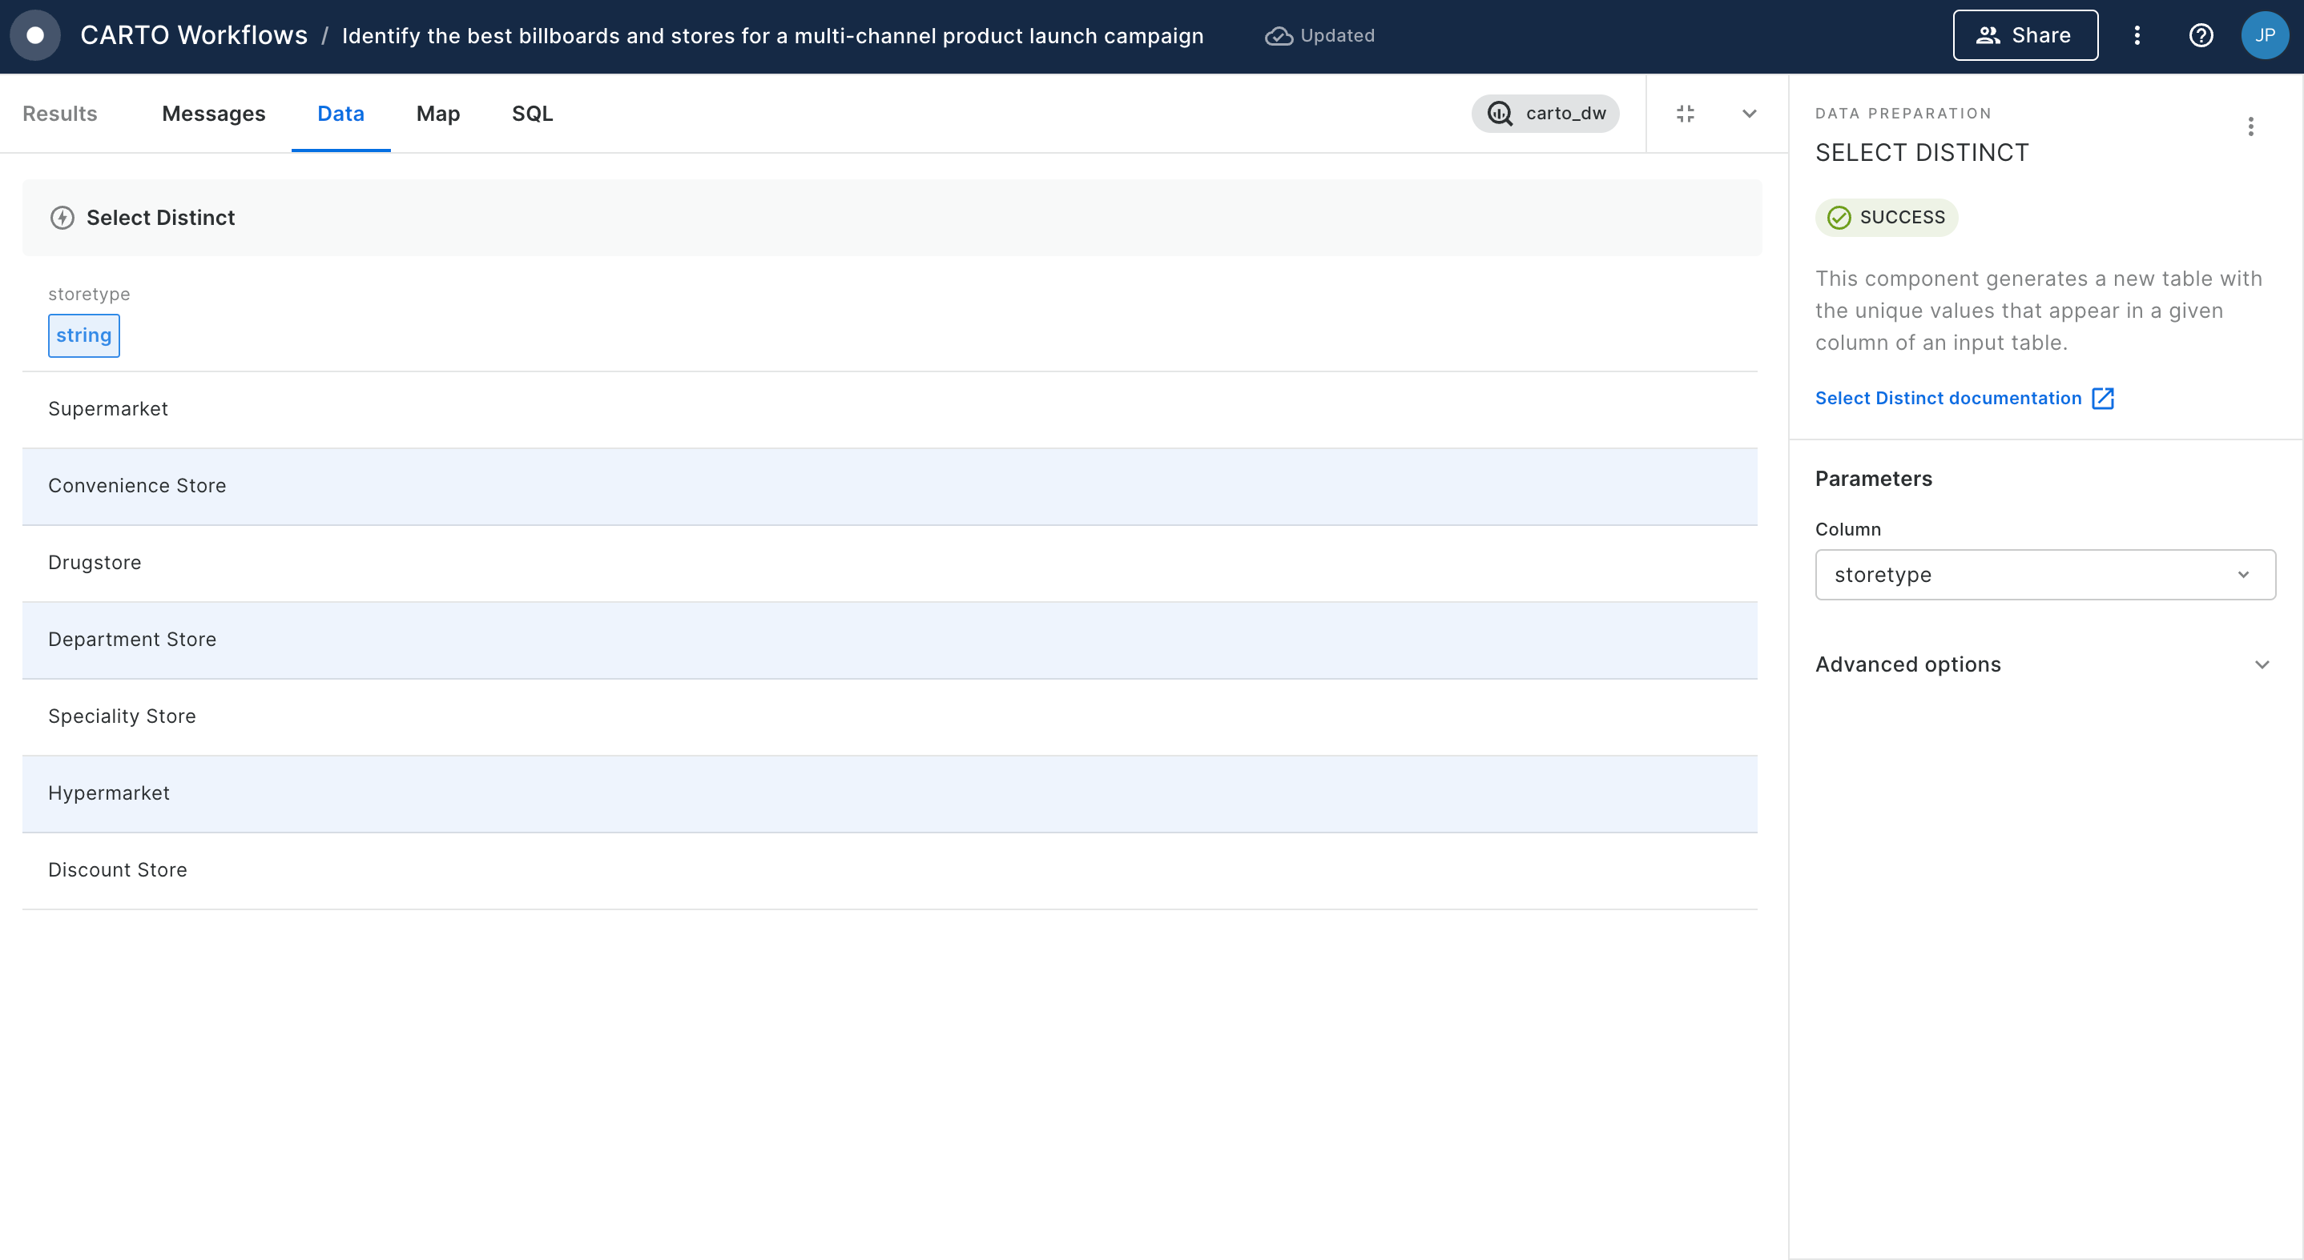
  1. We are going to add a Select Distinct component to find out what are the different categories of stores that we have in the table. We select the column "storetype" in the Select Distinct configuration. After clicking "Run" we check that we have the following types: Supermarket, Convenience Store, Drugstore, Department Store, Speciality Store, Hypermarket and Discount Store.
  1. As all store types are relevant to push our new product except of "Discount Store", we are going to add a new Simple Filter component and we will connect the retail_stores table as the input. We are going to configure column as 'storetype', operator as 'equal to' and value as 'Discount Store'. We click "Run".
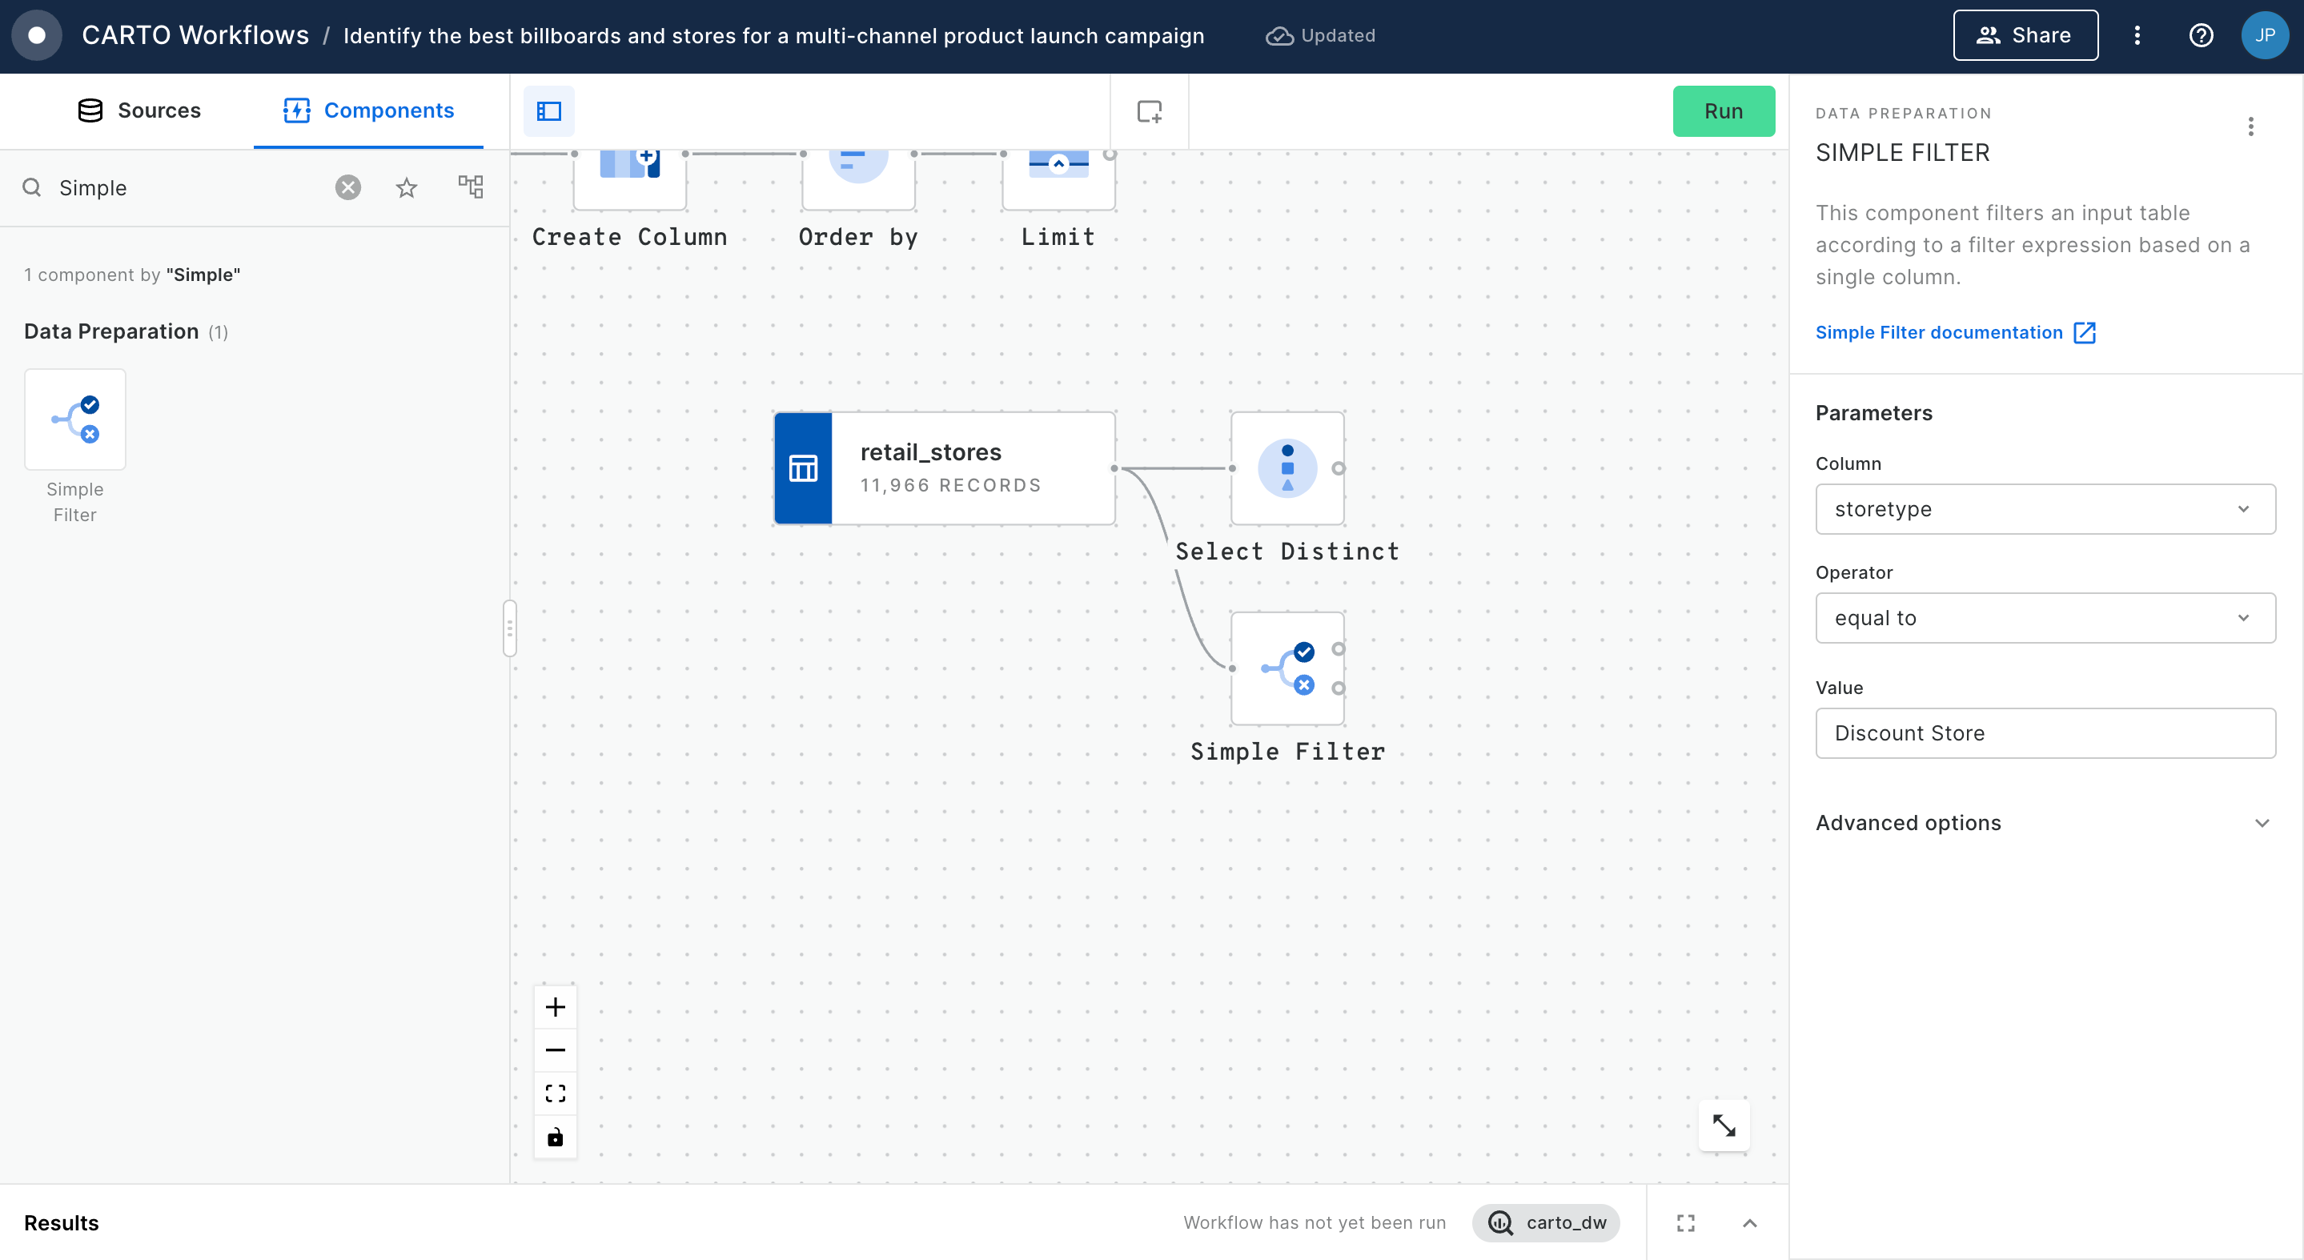
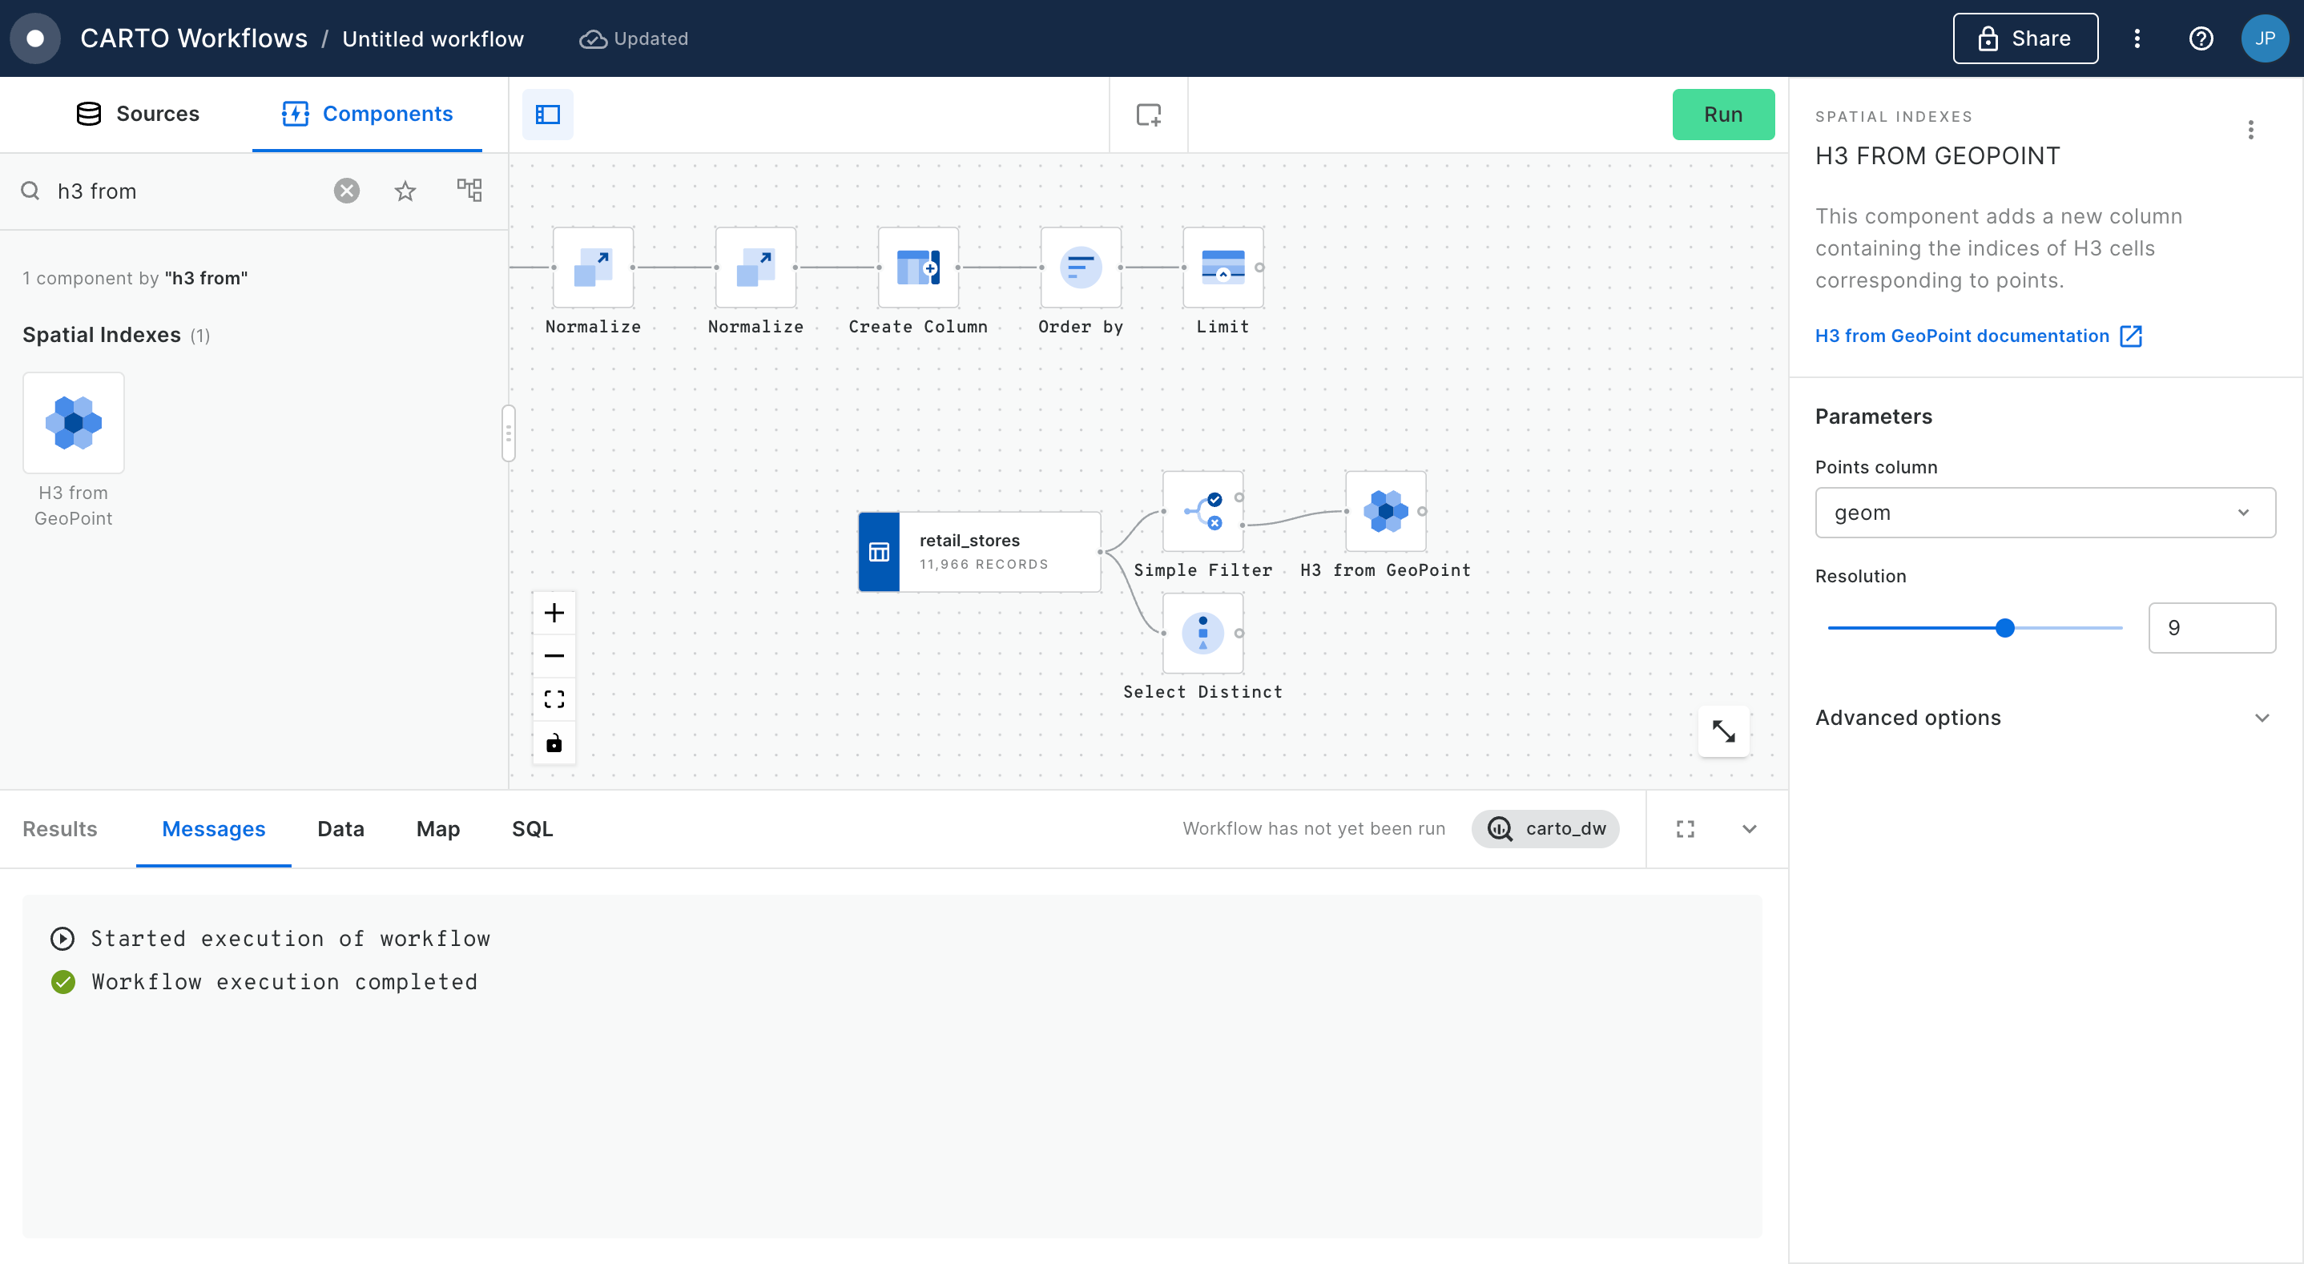
  1. From the previous step we are interested in the stores that have not matched our filter, therefore we need to continue our workflow by selecting the second output (the one identified with a cross). We now want to create also the H3 cells where the relevant stores are located, using the same resolution as in the other part of our workflow. To do that we will add the H3 from GeoPoint component and add it to our workflow. We are going to connect the "Unmatch" output from the Simple Filter and we are going to select the 'geom' as the Points column and '9' as resolution. After running the workflow we now have the H3 Resolution 9 cells where we have target store located.
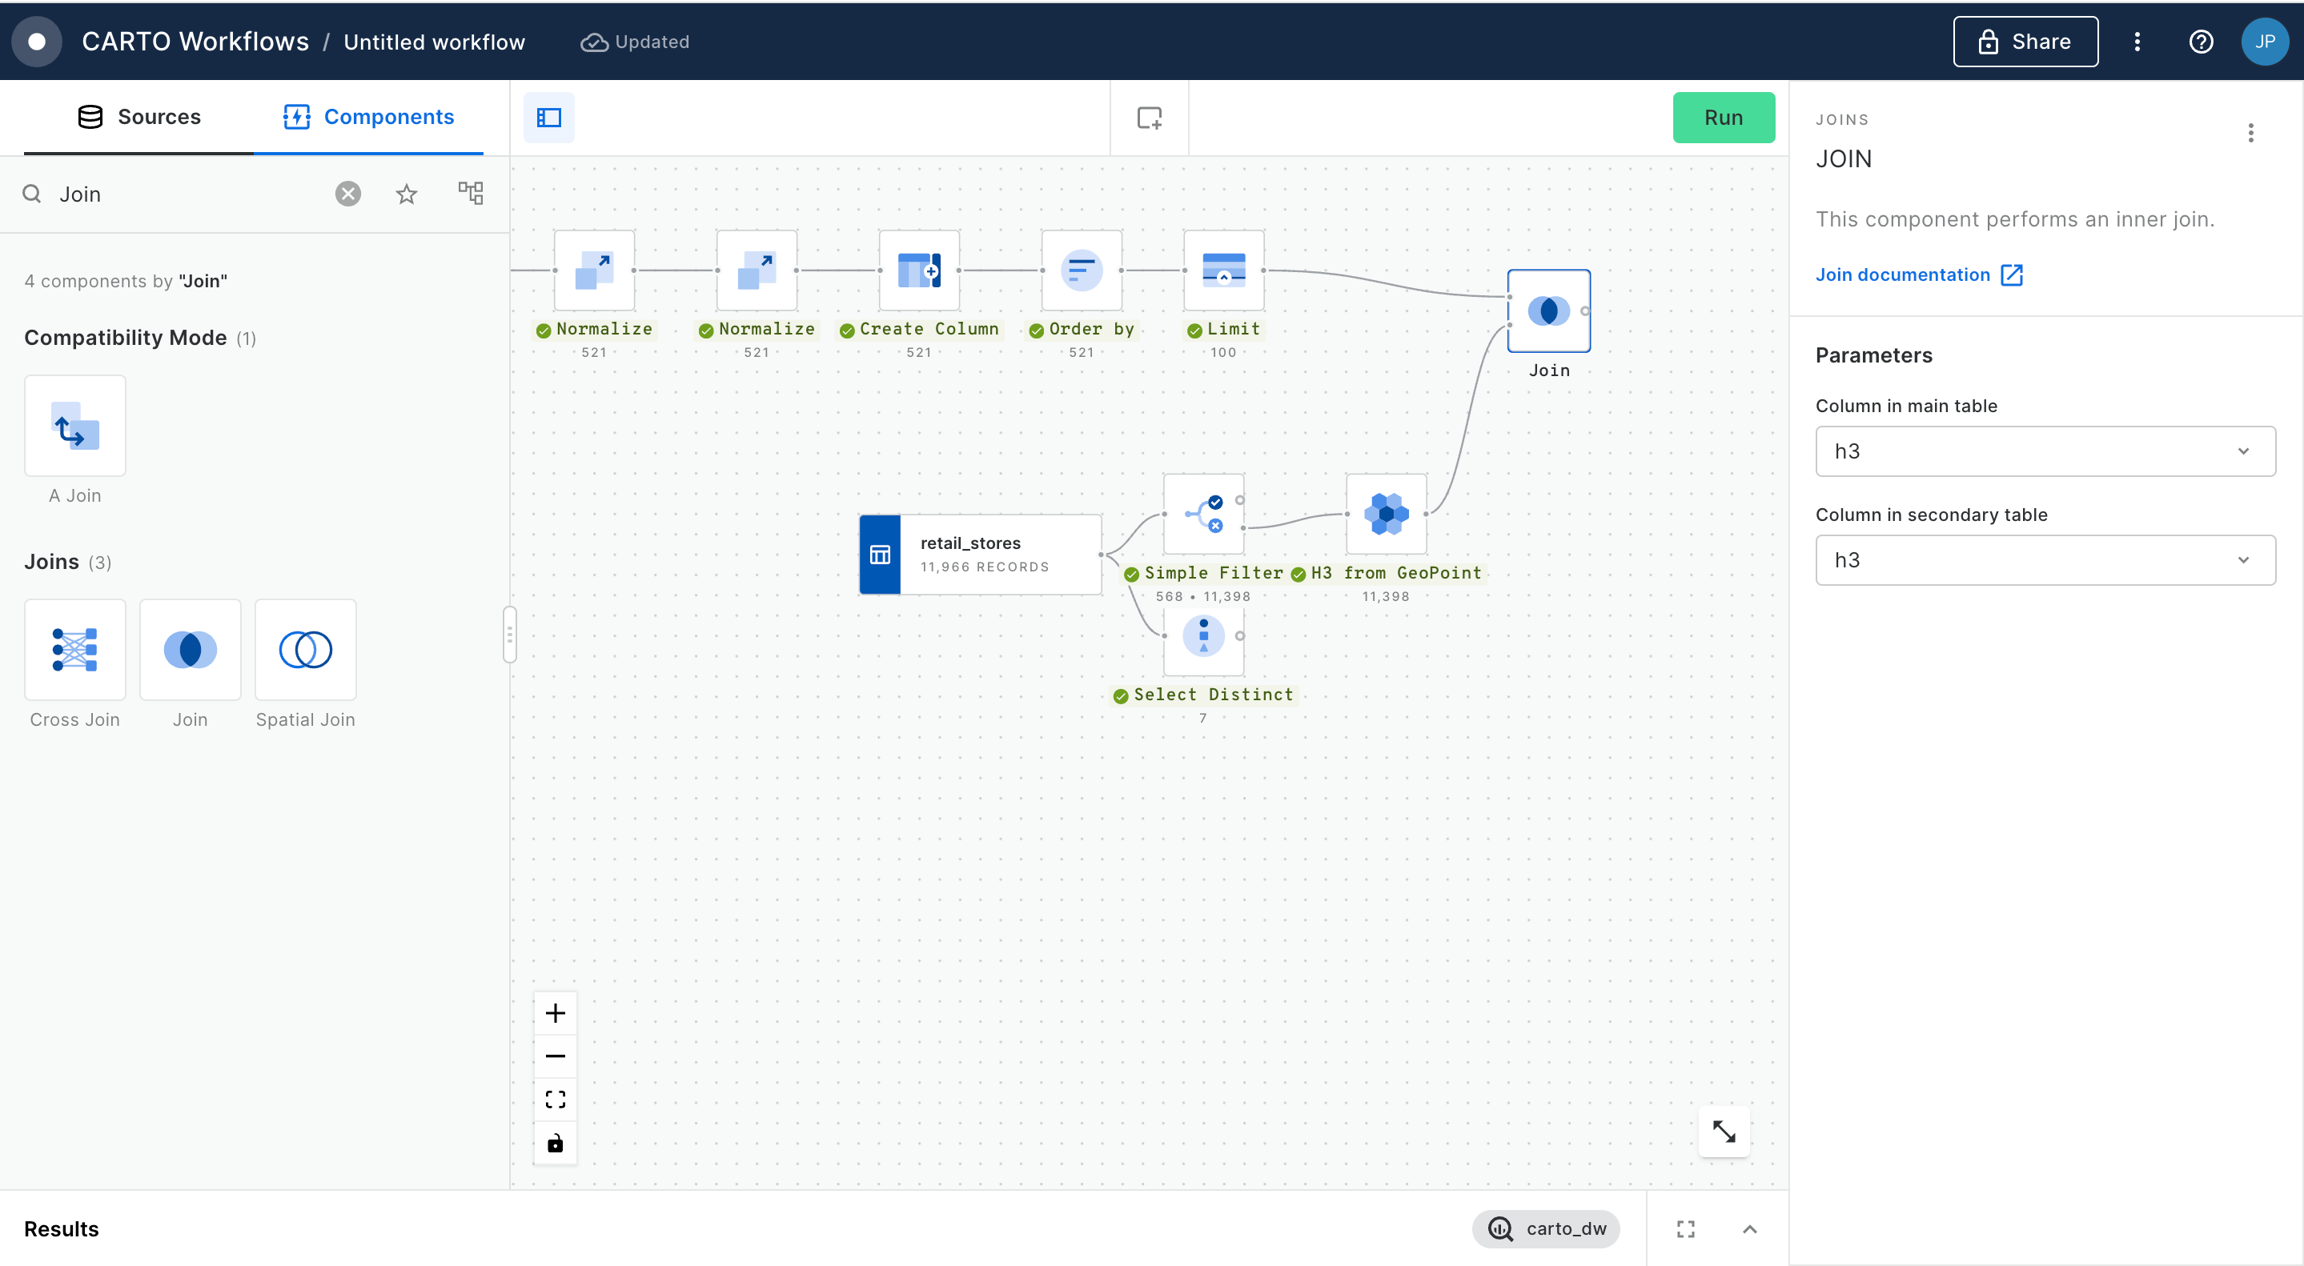
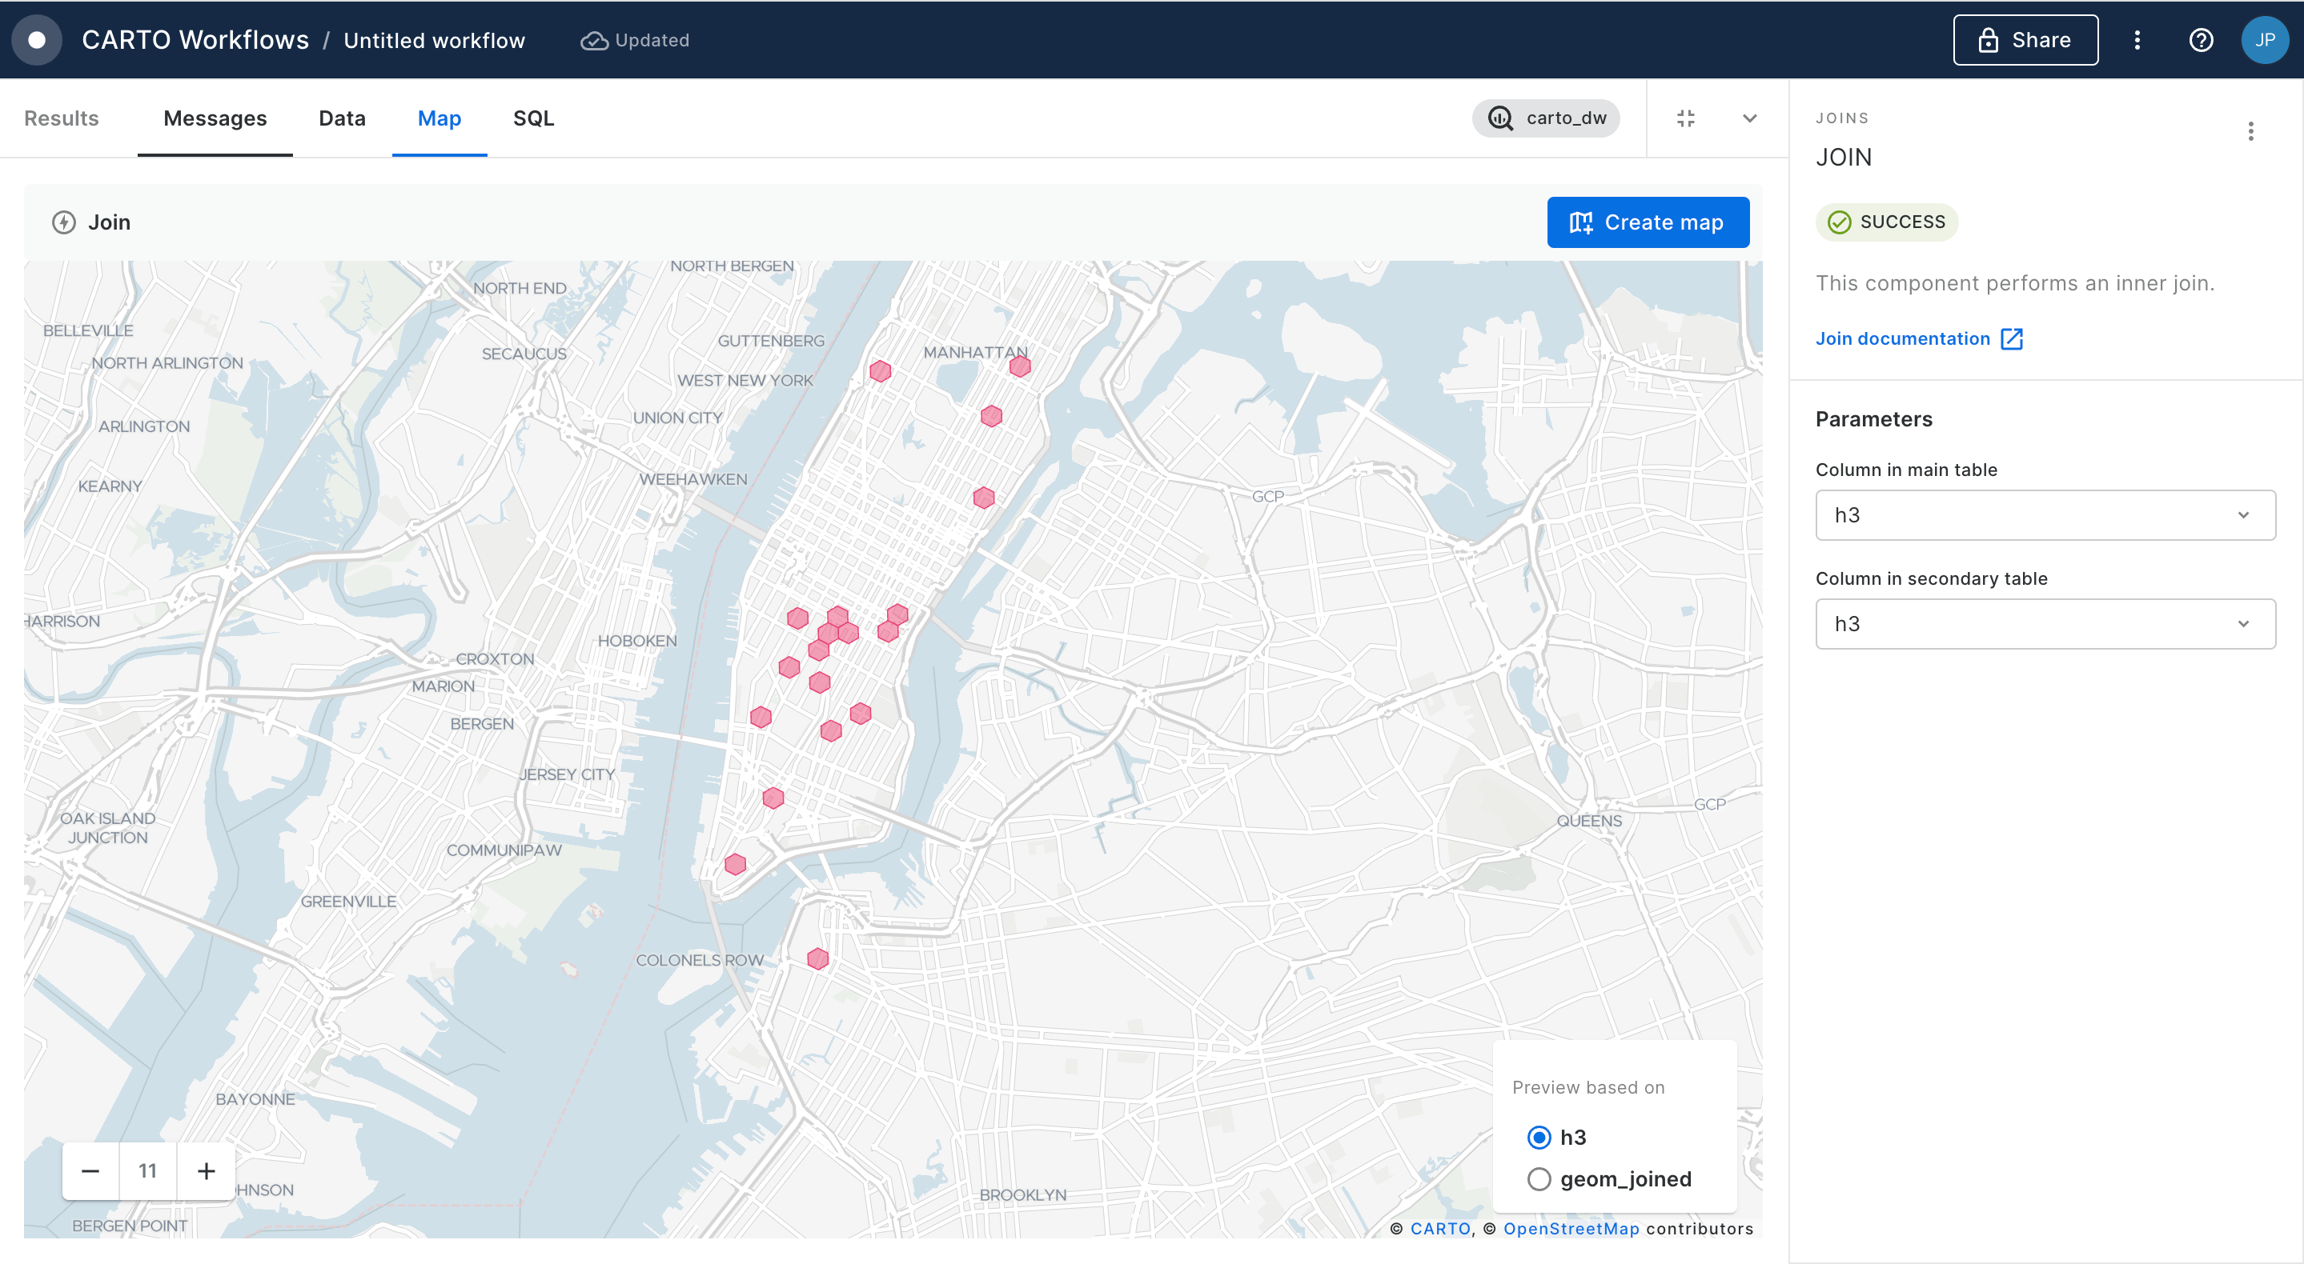
  1. Finally we want to join the H3 cells with the areas surrounding billboards scoring high for our target audience and those with available stores to push our product. To do that we are going to add another Join component and connect the otuputs of both branches of our workflow. We select h3 for both main and secondary tables. We click "Run".
Now we have the result that we wanted: areas at 300m from a billboard, scoring high for our target audience (high income female population with age between 18 and 40 years old) and with presence of relevant stores for doing promotional activities.
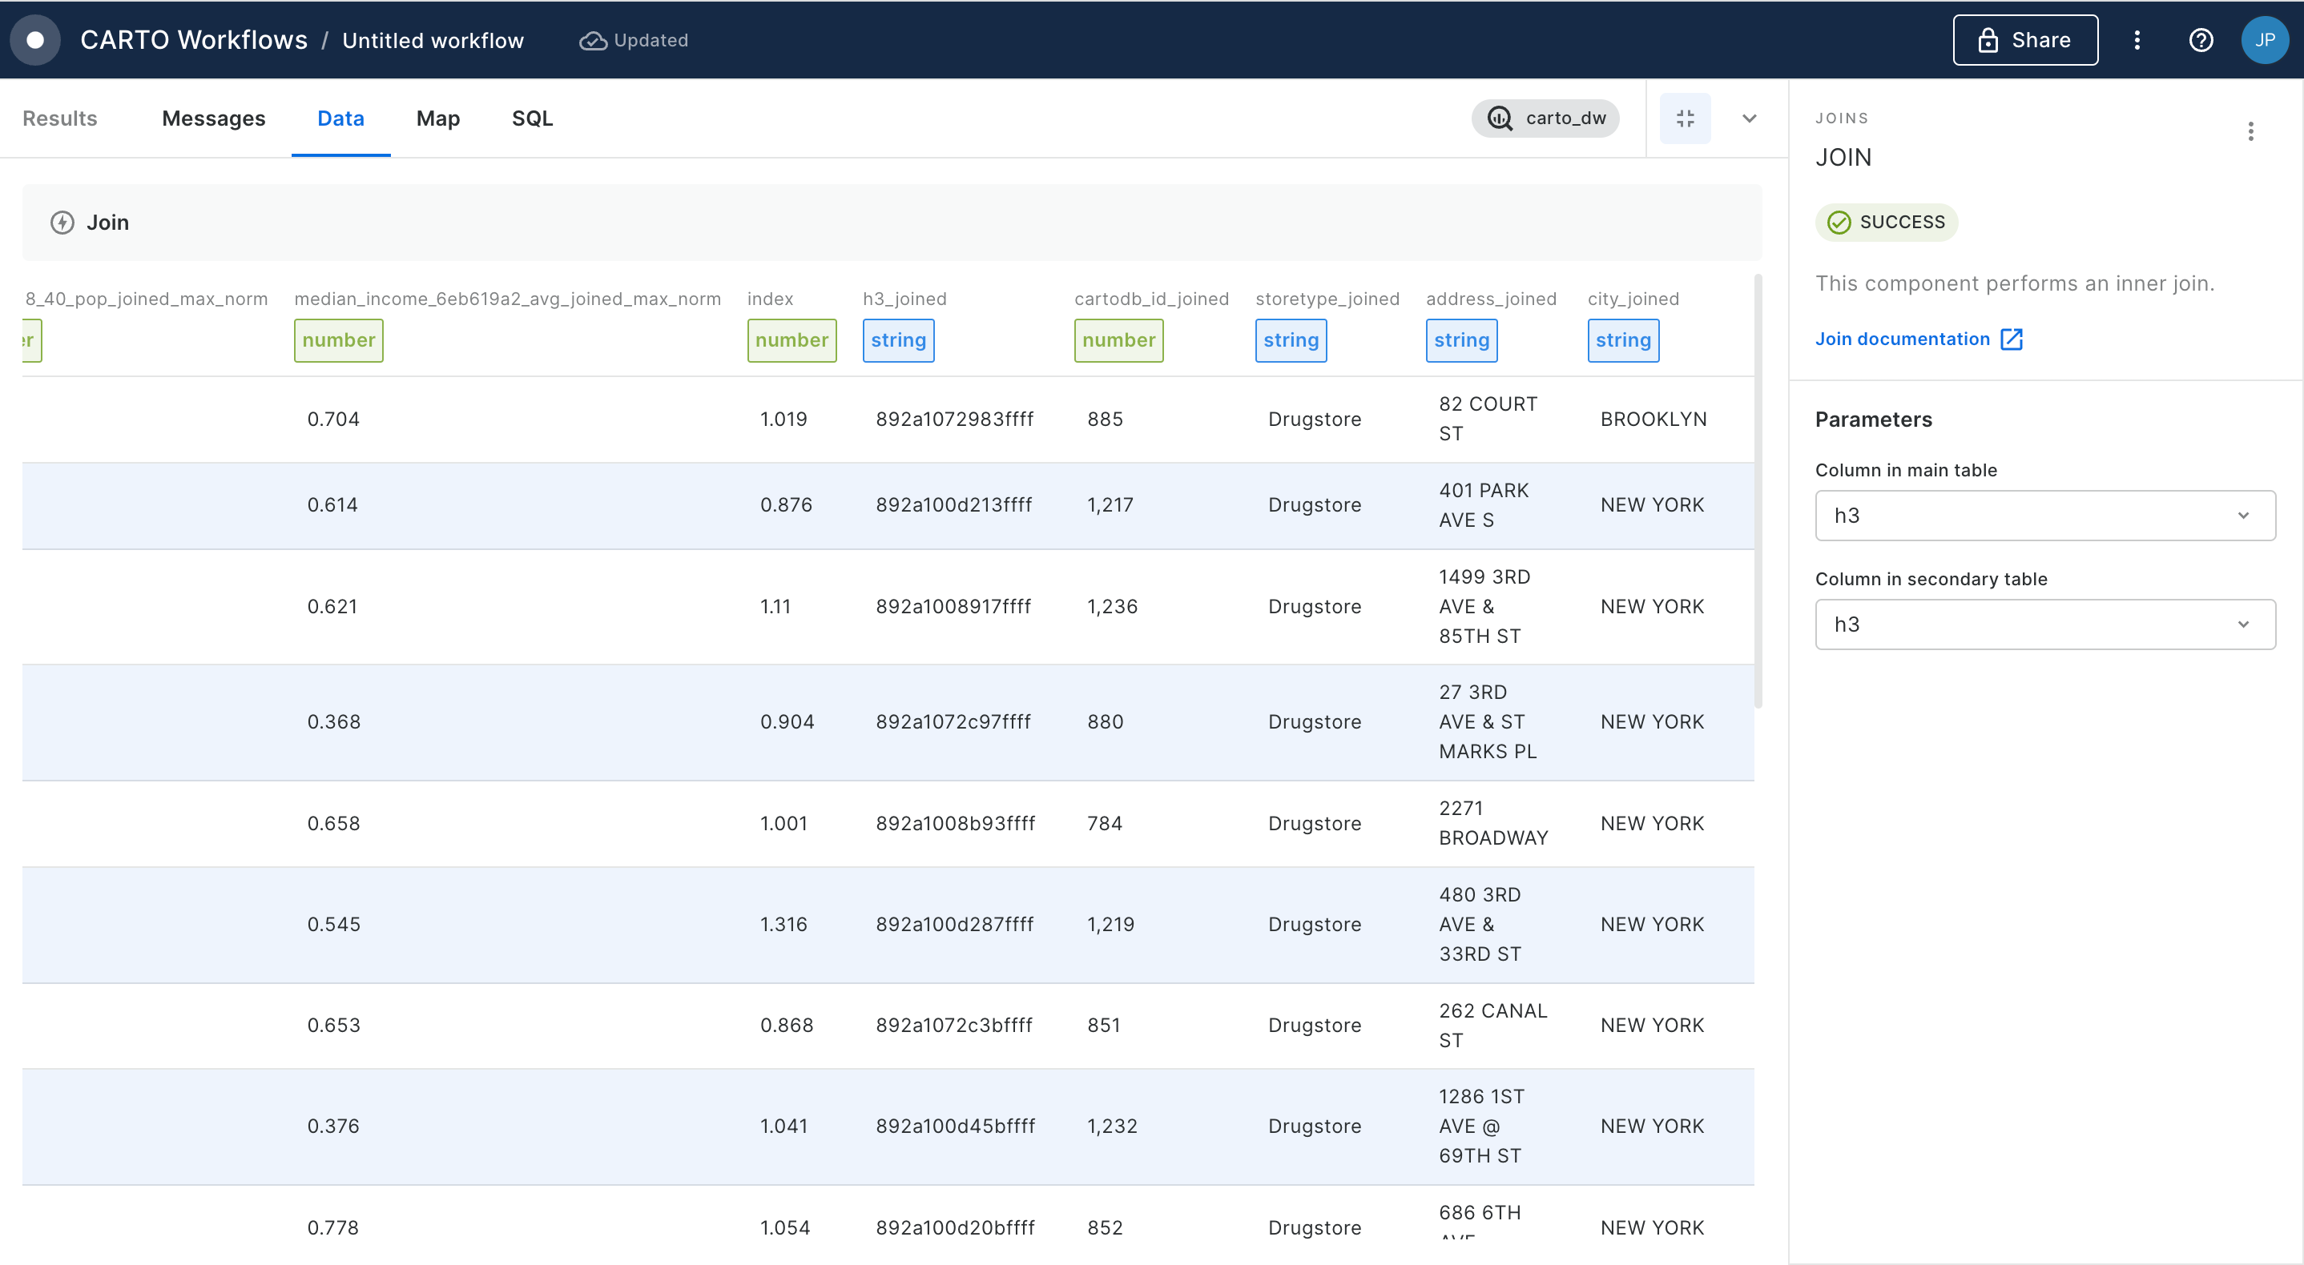
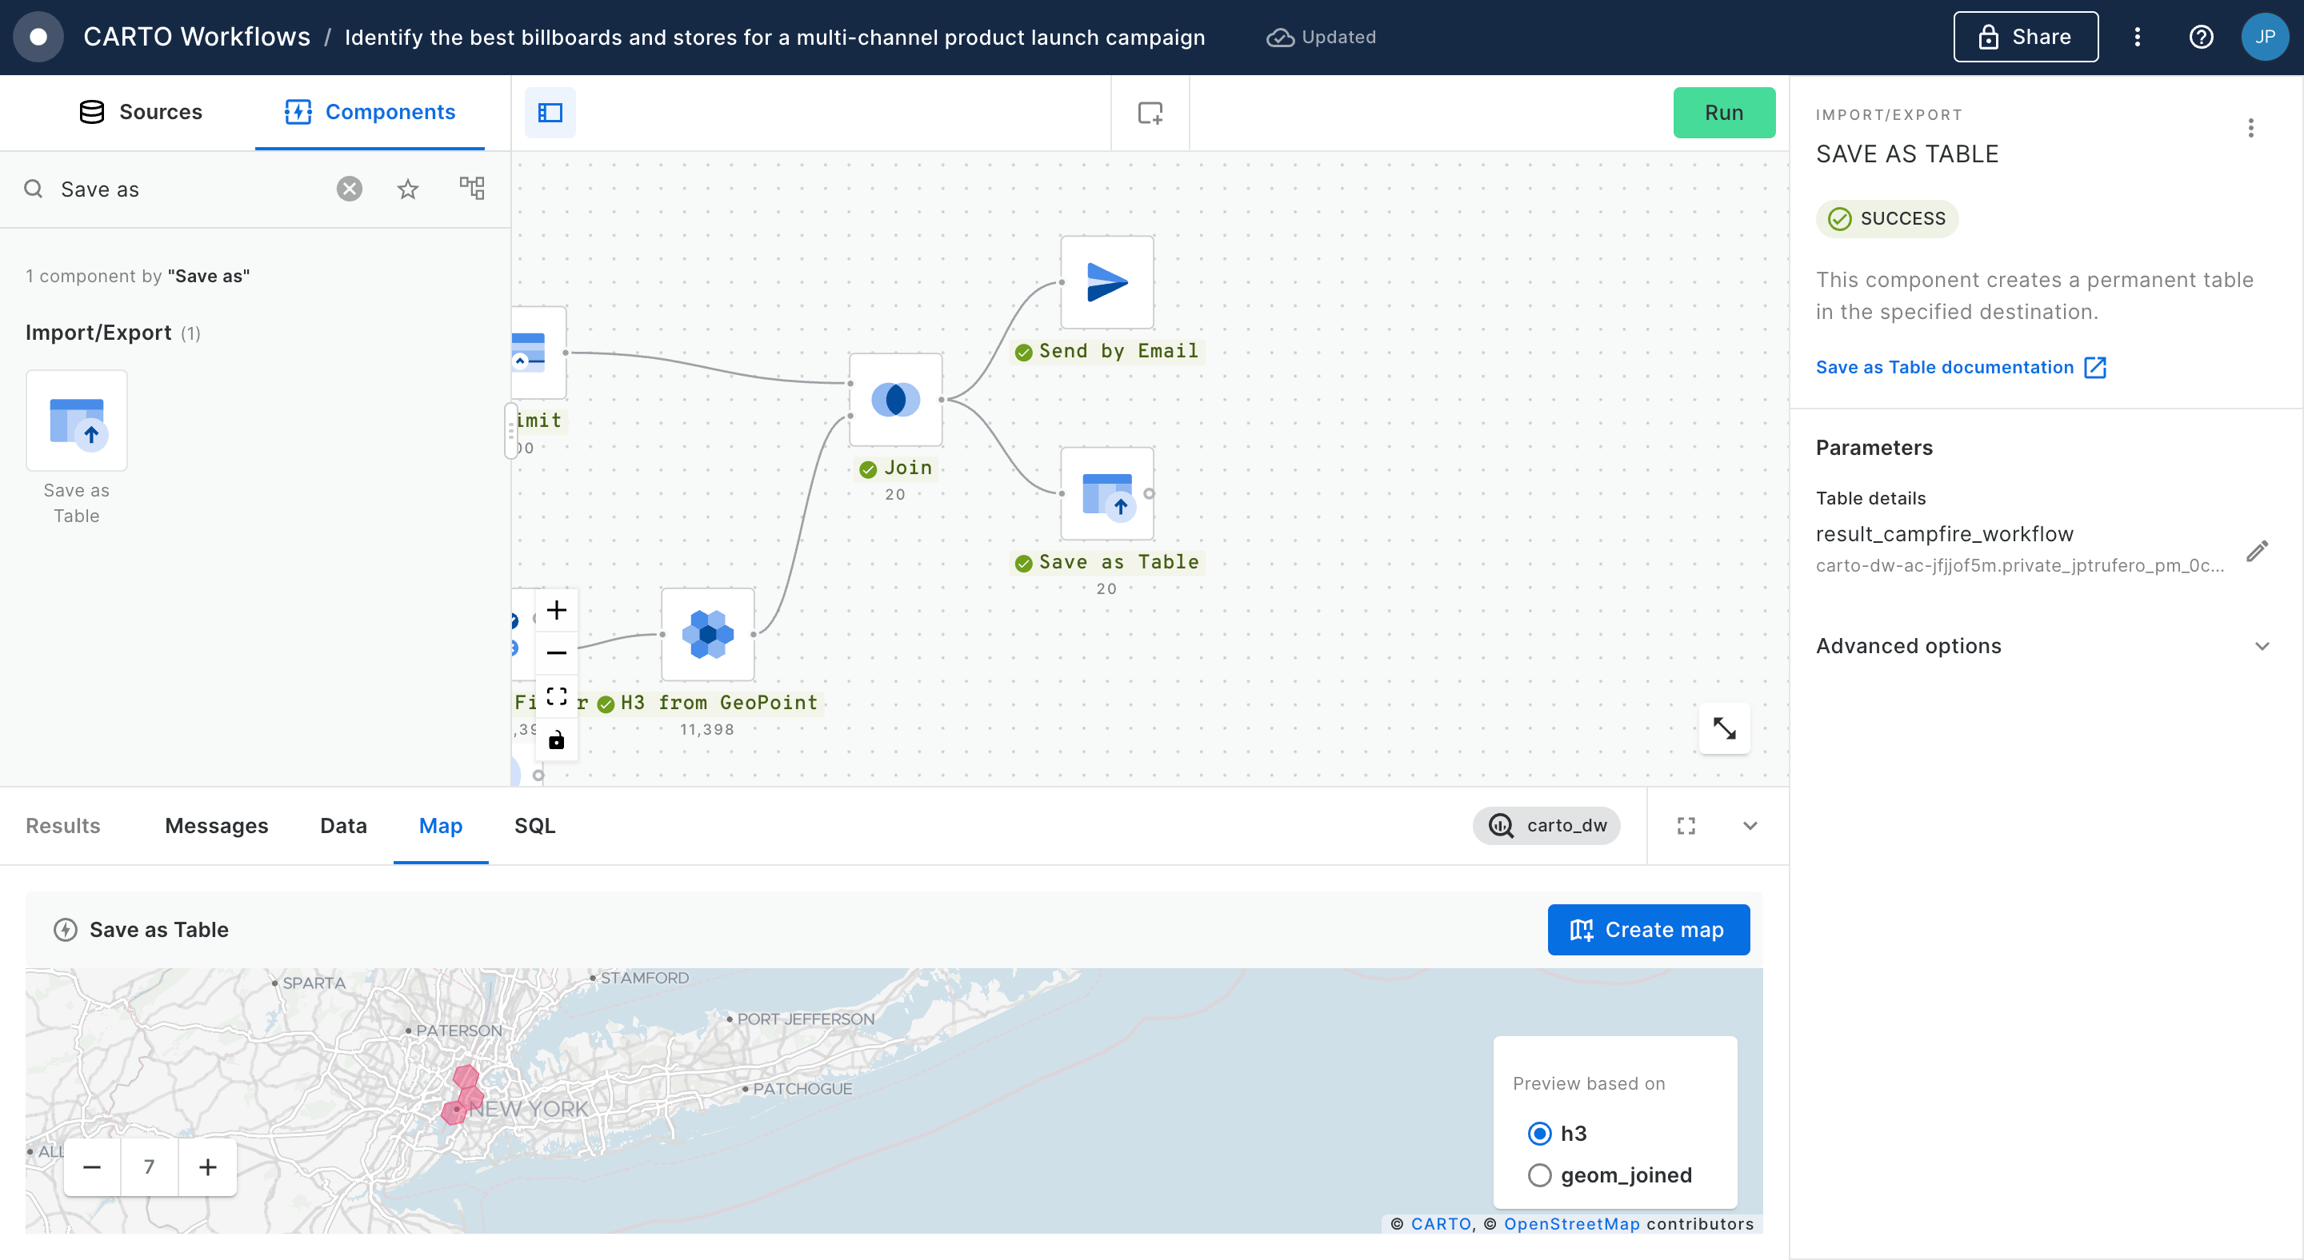
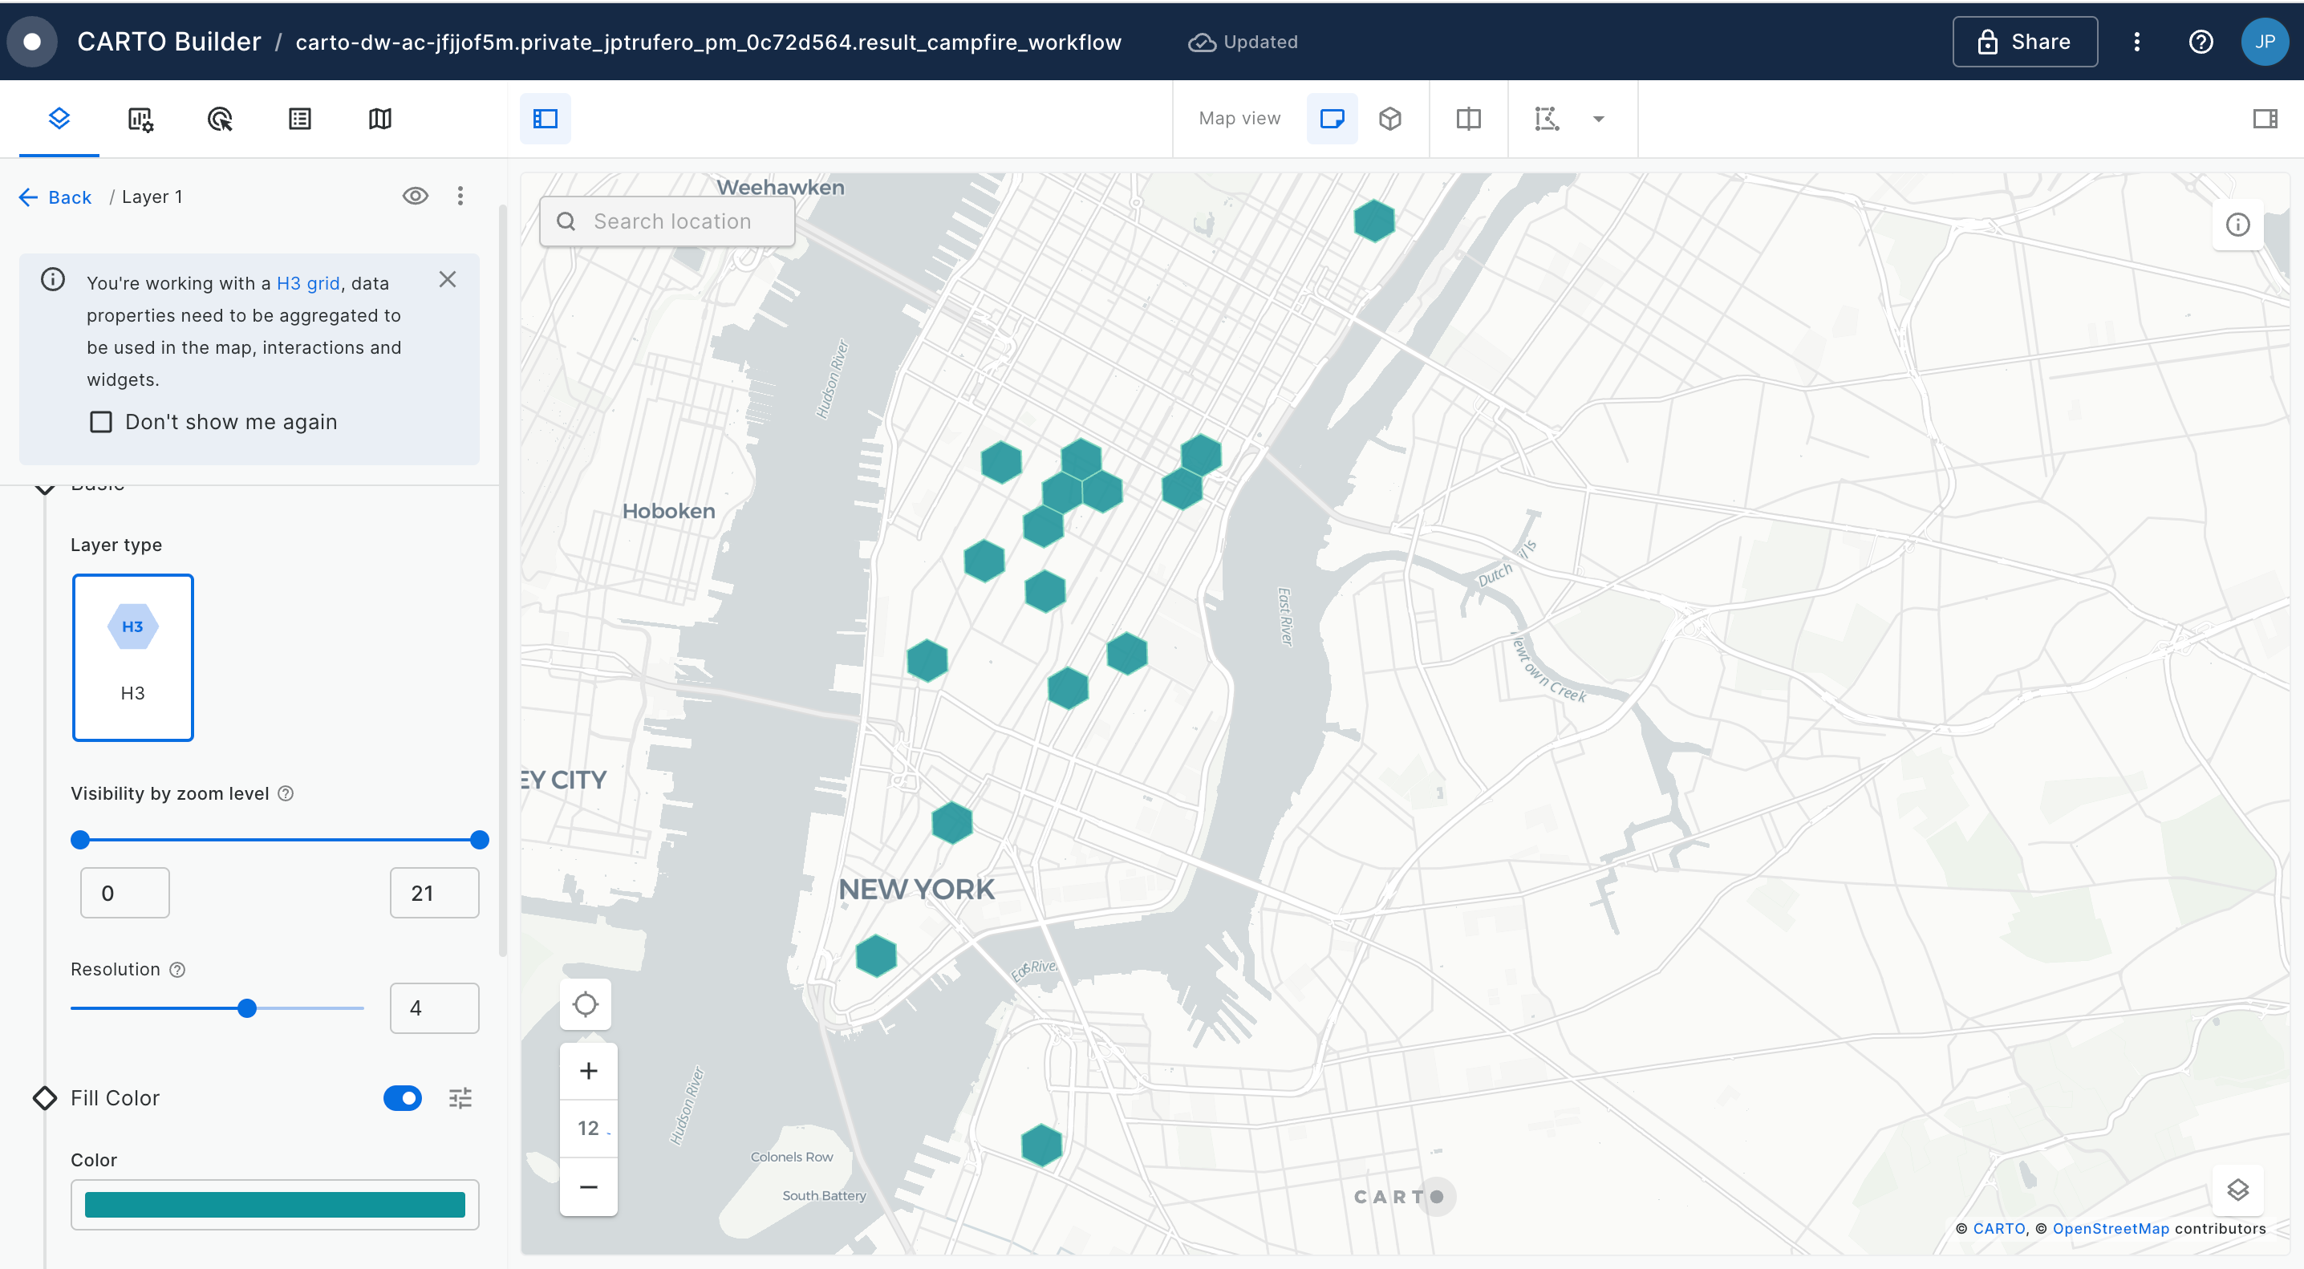
With this output we can now add components Save as table and Send by email to ensure our colleagues know about this insight and we keep the result saved in our data warehouse. From there, we can click on "Create map" to open a map in CARTO Builder with the result of our workflow as a layer.
Intermediate difficulty banner