Widgets & SQL Parameters
Builder enhances data interaction and analysis through two key features: Widgets and SQL Parameters. Widgets, linked to individual data sources, provide insights from map-rendered data and offer data filtering capabilities. This functionality not only showcases important information but also enhances user interactivity, allowing for deeper exploration into specific features.
Meanwhile, SQL Parameters act as flexible query placeholders. They enable users to modify underlying data, which is crucial for updated analysis or filtering specific subsets of data.

Widgets
Widgets, linked to individual data sources, provide insights from map-rendered data and offer data filtering capabilities. This functionality not only showcases important information but also enhances user interactivity, allowing for deeper exploration into specific features.
Adding a Widget
Add a widget to Builder by clicking "New Widget" and select your data source.
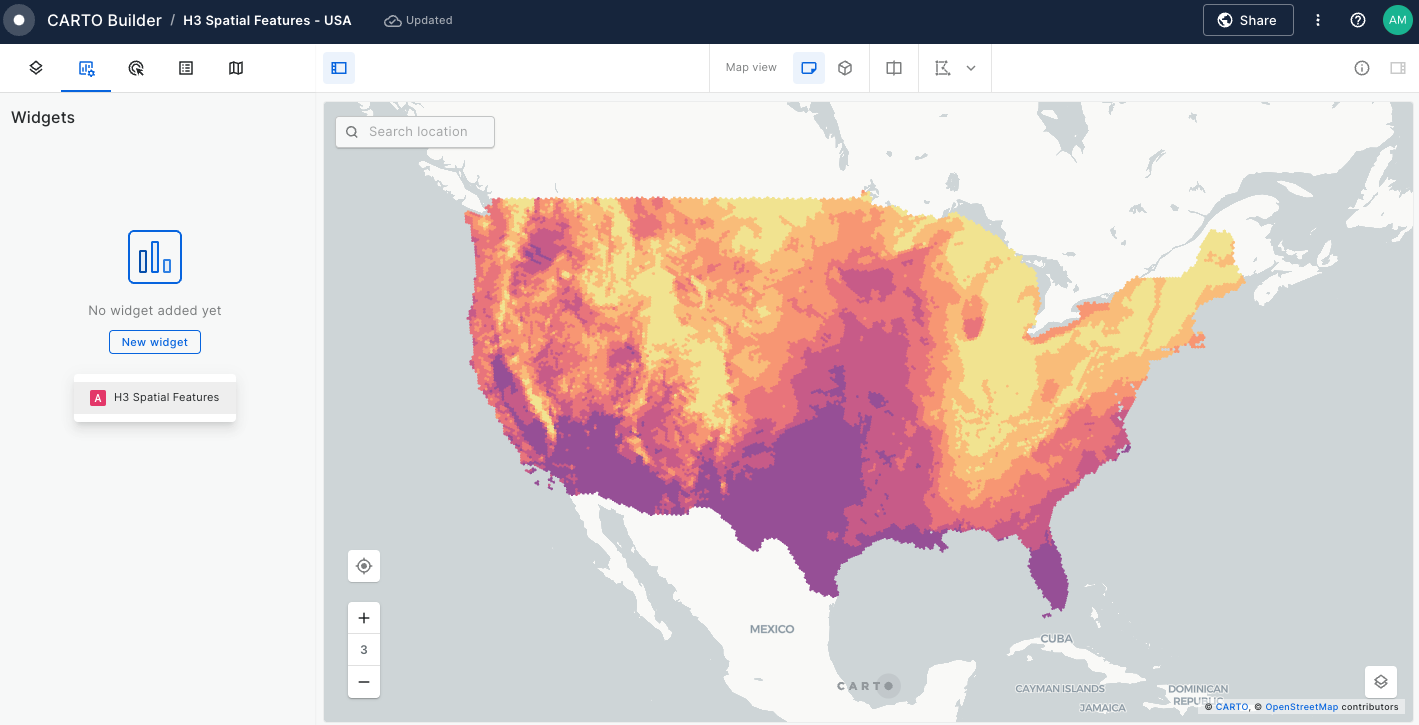
Then, select a widget type from the menu: Formula, Category, Histogram, Range, Time Series or Table.
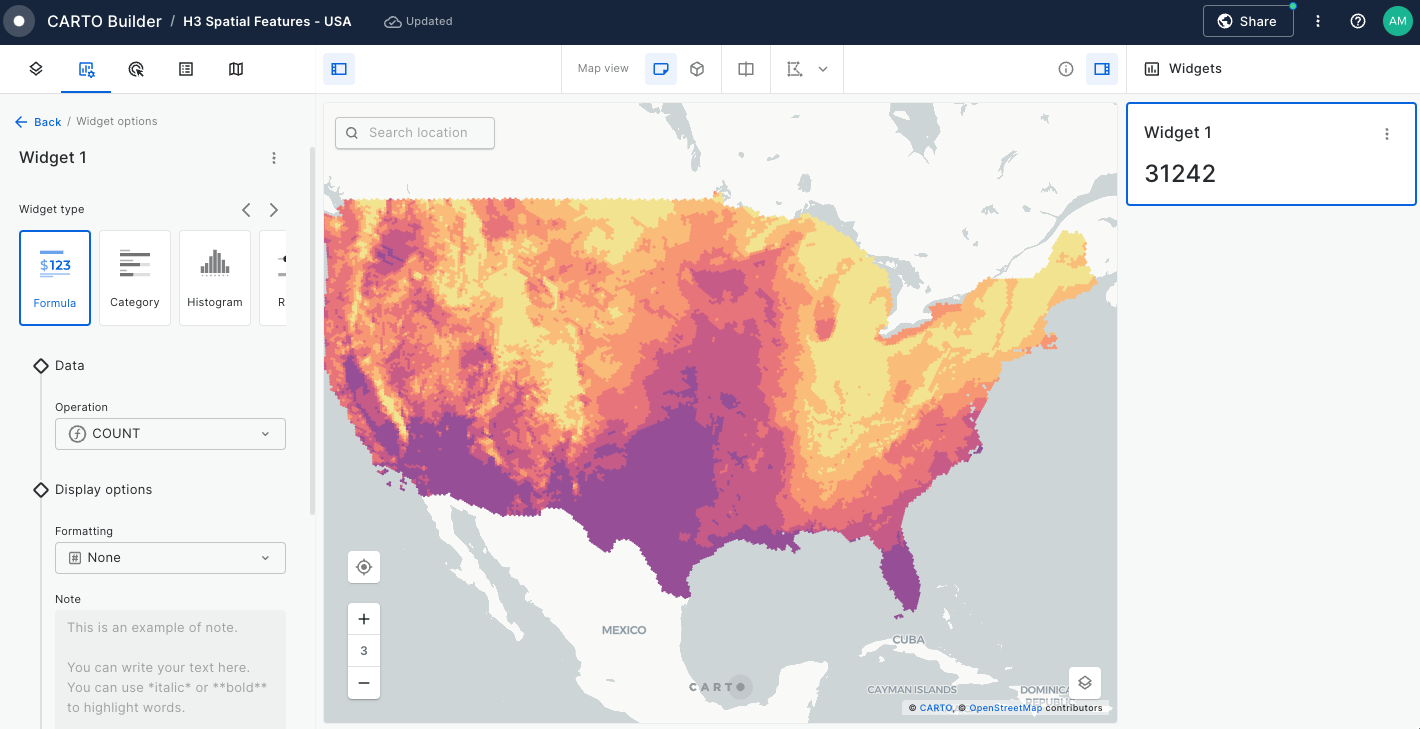
Configuring a Widget
Once you have selected the widget type of your preference, you are ready to configure your Widget.
Widget Data
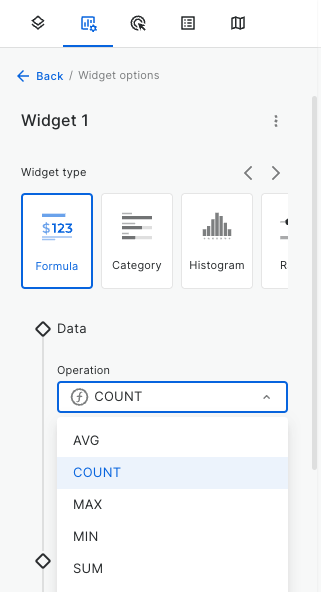
In the Data section of the Widget configuration, choose an aggregation operation COUNT, AVG, MAX, MIN or SUM and, if relevant, specify the column on which to perform the aggregation.
Widget Display
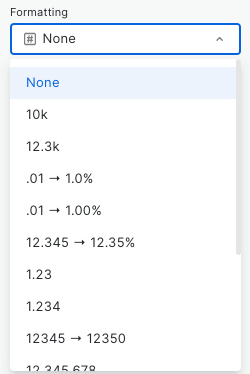
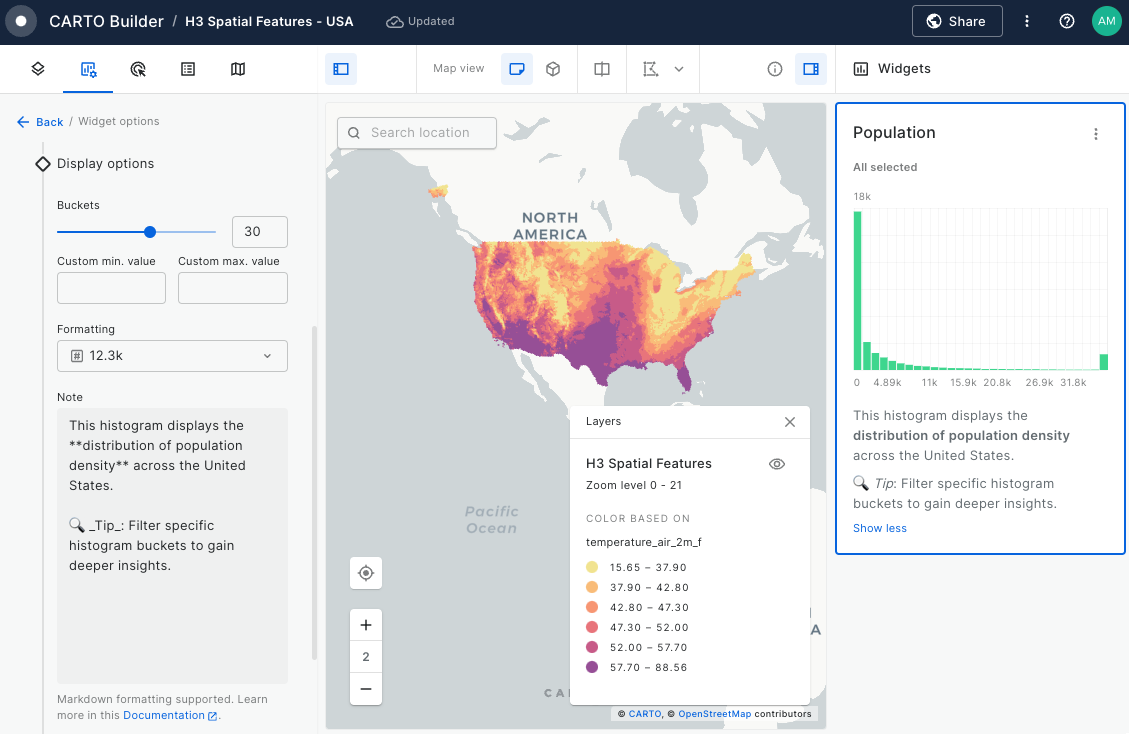
Using the Formatting option, you can auto-format data, ensuring enhanced clarity. For instance, you can apply automatic rounding, comma-separations, or percentage displays.
You can use Notes to supplement your Widgets with descriptive annotations which support Markdown syntax, allowing to add text formatting, ordered lists, links, etc.
Widget Behavior
Widgets in Builder automatically operate in viewport mode, updating data with changes in the viewport. You can also configure them for global mode to display data for the entire source.

Furthermore, Widgets can be set as collapsible for convenient hiding. Some widgets have the capability to filter not only themselves but also related widgets and connected layers. This filtering capability can be easily enable or disable for each widget using the cross-filtering icon.
SQL Parameters
SQL Parameters serve as placeholders in your SQL Query data sources, allowing viewer users to input specific values that dynamically replace these placeholders. This allows users to interactively customize and analyze the data displayed on their maps.
SQL Parameters are categorized based on the data format of the values expected to be received, ensuring flexibility and ease of use. Below are the current type of SQL Parameters:
Date Parameter: Ideal for handling date values, date parameters allow users to input a specific date range, enabling data analysis over precise time periods. For example, analyzing sales data for a specific month or quarter.
Text Parameter: Tailored for text values, users can input or select a specific category to obtain precise insights. For instance, filtering Points of Interest (POI) types like "Supermarket" or "Restaurant".
Numeric Parameter: Designed for numeric values, users can input specific numerical criteria to filter data or perform analysis based on their preferences. For example, updating the radius size of a geofence to update an analysis result.
Using SQL Parameters
SQL Parameters can be used in many different ways. One of the most common is allowing viewers to interact with the data in a controlled manner. Let's cover a simple use case step by step:
Add a SQL Query data source
The option to create a new SQL Parameter will be available once there is at least one data source of type Query:
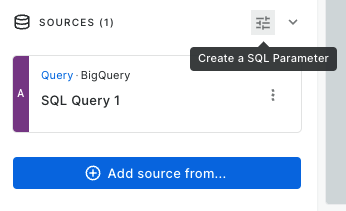
So, let's create a SQL Query data source with a table that contains information about fires all over the world:
On a new map, click on 'Add source from...' and select 'Custom query (SQL)' .
Select CARTO Data Warehouse as connection.
Use the following query
Create and configure a text parameter
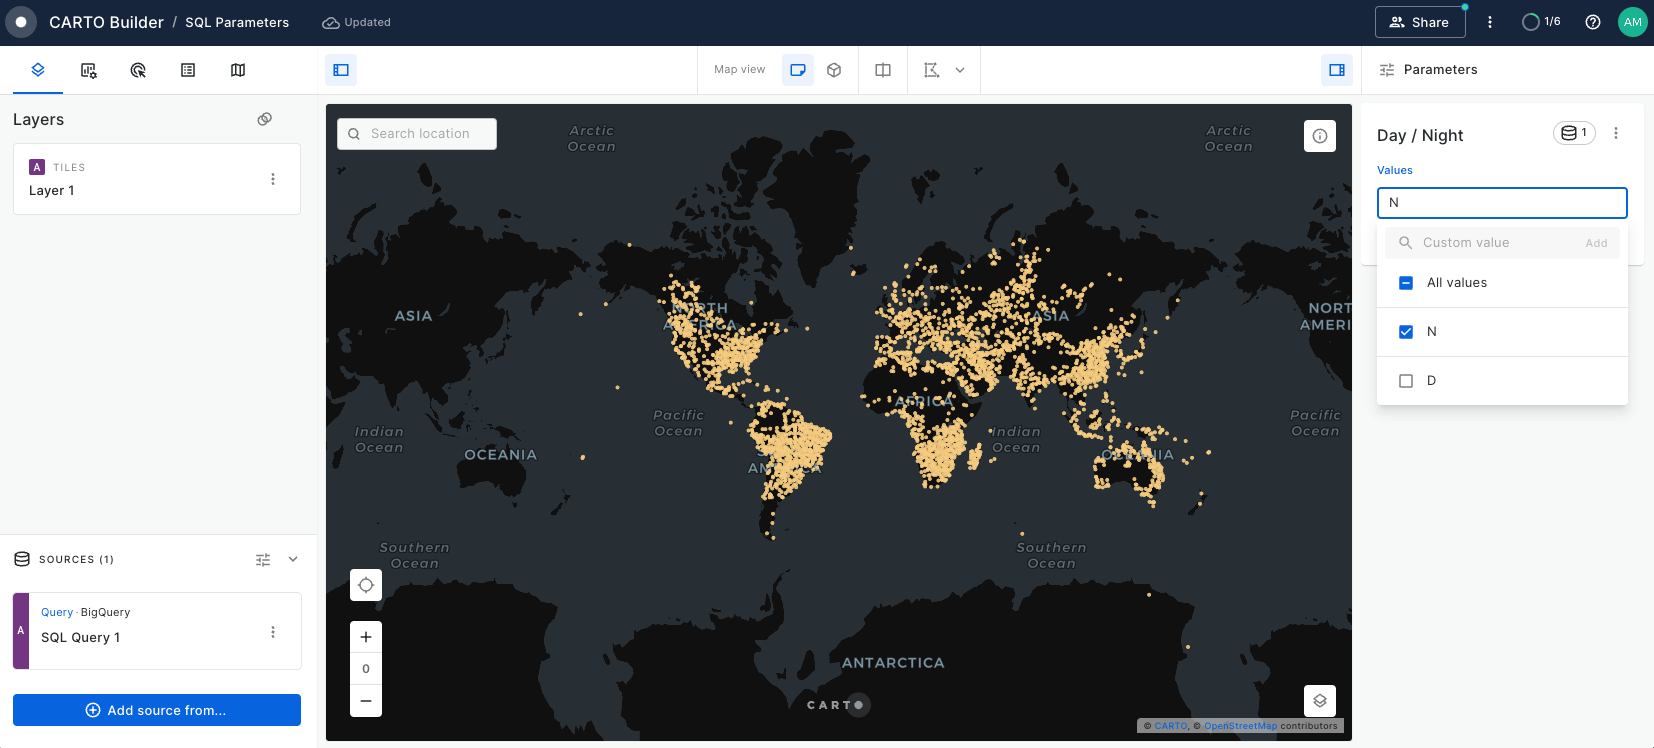
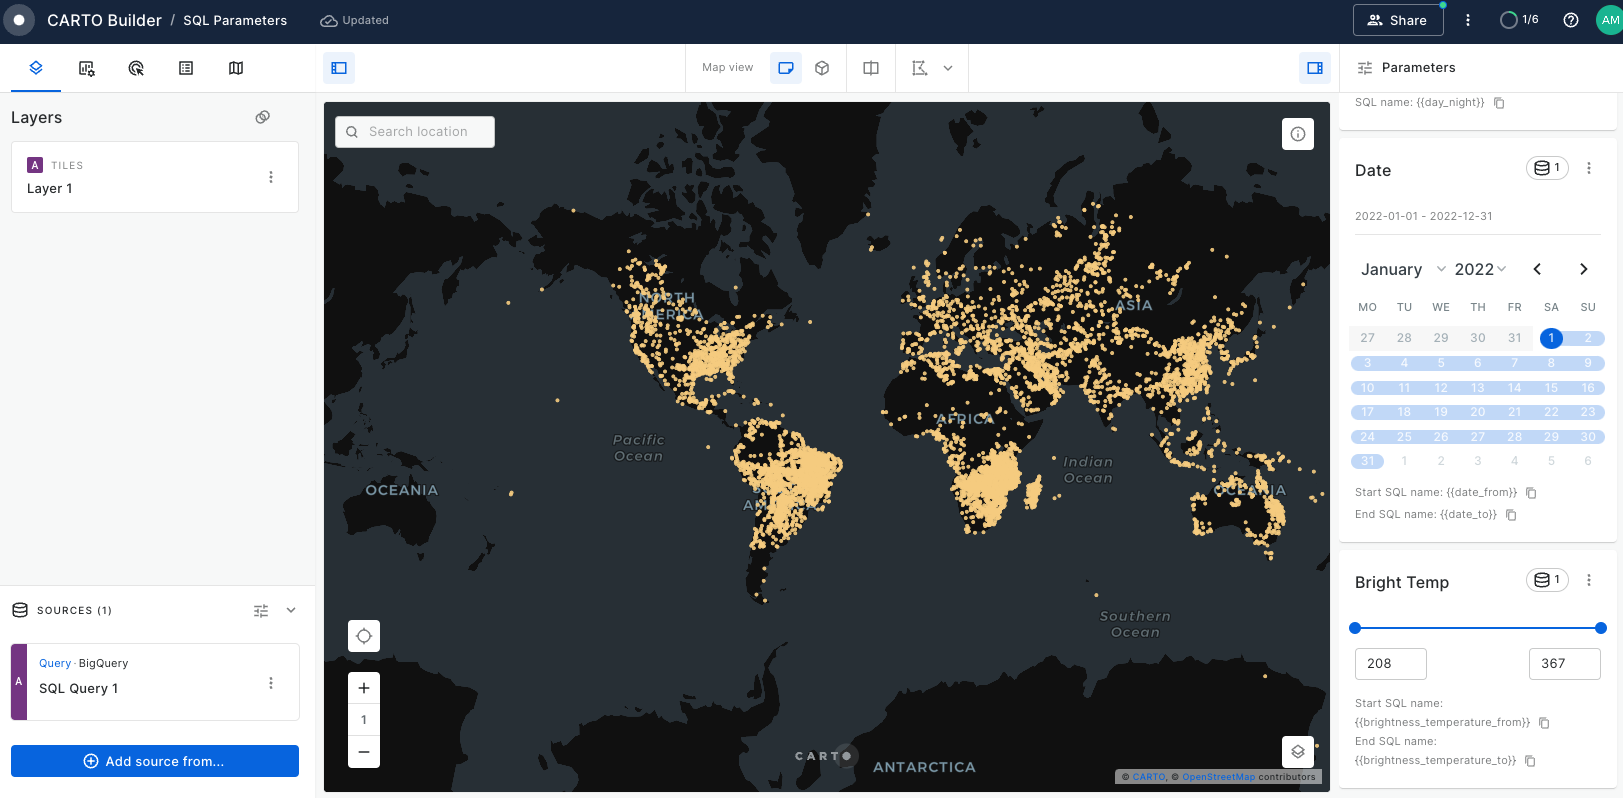
Once we have the data rendered in the map, we'll add a text parameter that helps us select between fires that happened during the day or the night.
Click on 'Create a SQL Parameter'
Select 'Text Parameter'
In the 'Values' section, click on 'Add from source'. Select your data source and pick the
daynightcolumnIn the 'Naming' section, pick a display name, like 'Day/Night'. The SQL name gets automatically generated as
{{day_night}}After the parameter has been created, open the SQL panel and add it to your query:
You can now use the control UI to add/remove values and check how the map changes.
Create and configure a date parameter
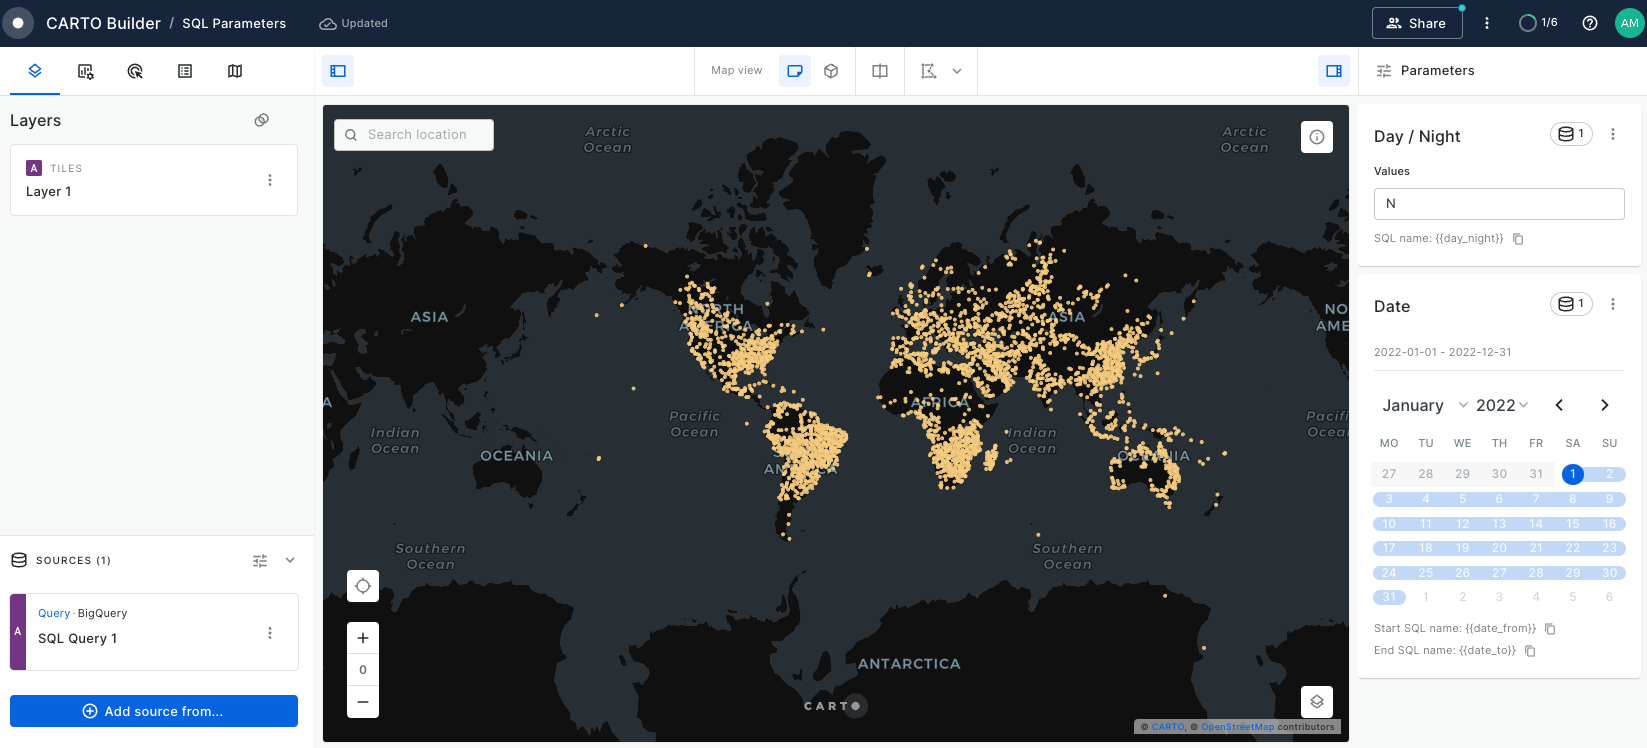
Now, let's add a date parameter to filter fires by its date:
Click on 'Create a SQL parameter'
Select 'Date parameter'
Type or select from a calendar the range of dates that are going to be available from the control UI.
Give it a display name, like 'Date'. The SQL names gets automatically generated as
{{date_from}}and{{date_to}}
Open the SQL Panel and add the parameters to your query, like:
The parameters {{date_from}} and {{date_to}} will be replaced by the dates selected in the calendar.
Create and configure a numeric parameter
Next, we'll incorporate a range slider to introduce a numeric parameter. It will allow users to focus on fires based on their brightness temperature to identify the most intense fires.
Click on 'Create a SQL parameter'
Select 'Numeric parameter'
In the 'Values' section, select Range Slider and enter the 'Min Value' and 'Max Value' within the range a user will be able to select.
Give it a display name, like 'Bright Temp'. The SQL names gets automatically generated as
{{bright_temp_from}}and{{bright_temp_to}}
Open the SQL Panel and add the parameters to your query, like:
Last updated
Was this helpful?

