Step-by-step tutorials
In this section you can find a set of tutorials with step-by-step instructions on how to solve a series of geospatial use-cases with the help of CARTO Workflows.
Skip to...
Insurance

Using crime data & spatial analysis to assess home insurance risk
In this tutorial, we'll be using individual crime location data to create a crime risk index. This analysis is really helpful for insurers looking to make more intelligent policy decisions - from customized pricing of premiums to tailored marketing.
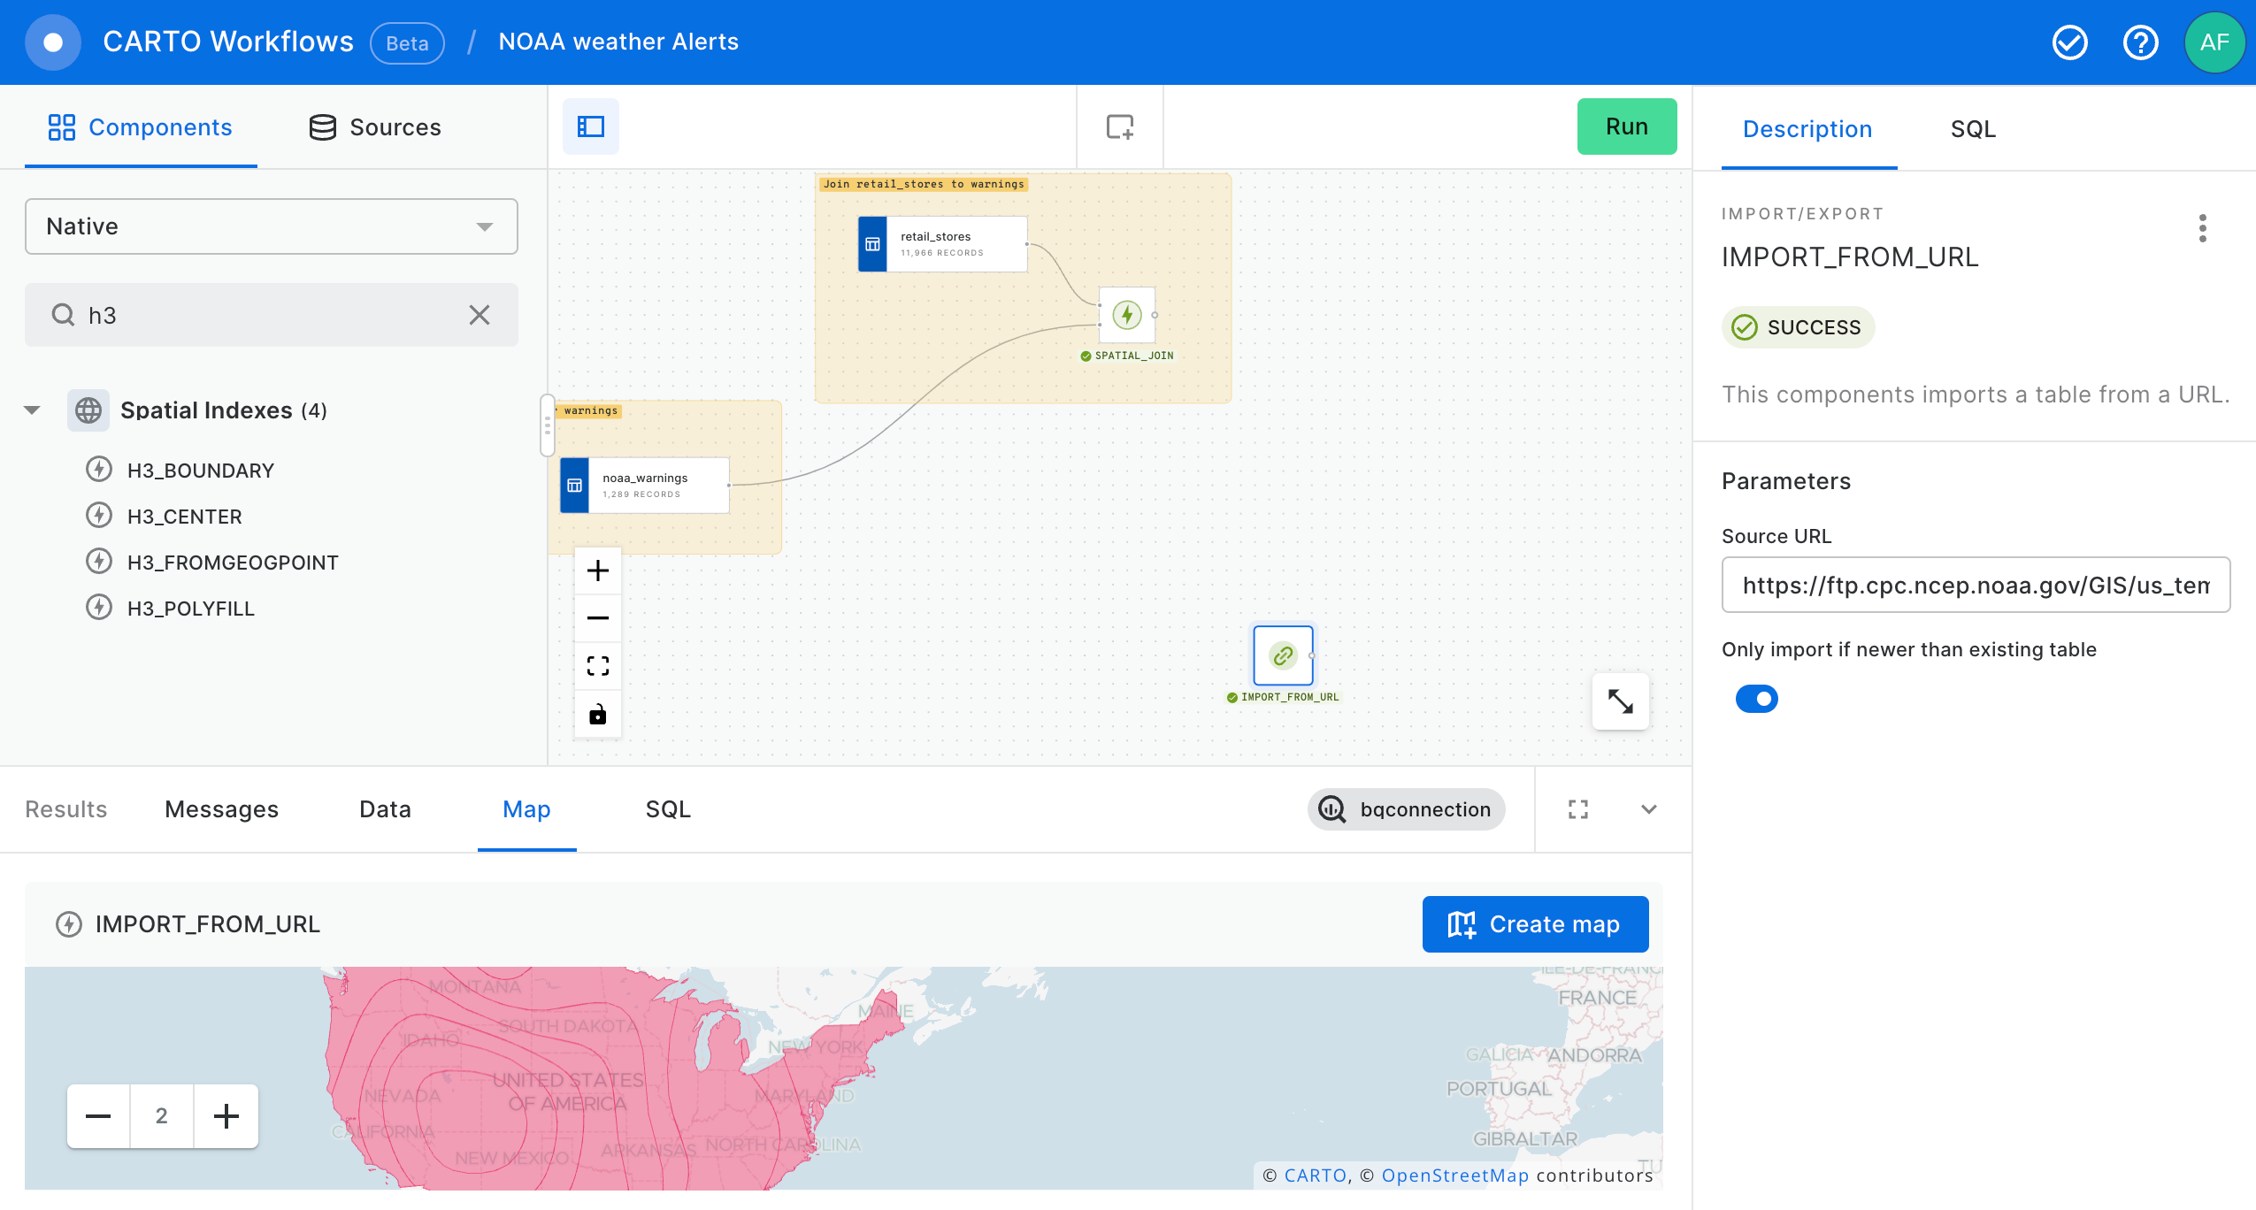
Finding stores in areas with weather risks
Leverage CARTO Workflows and Builder to analyze weather risk data from NOAA, to figure out which retail stores locations are exposed to a weather-related risk in the US.
Telco
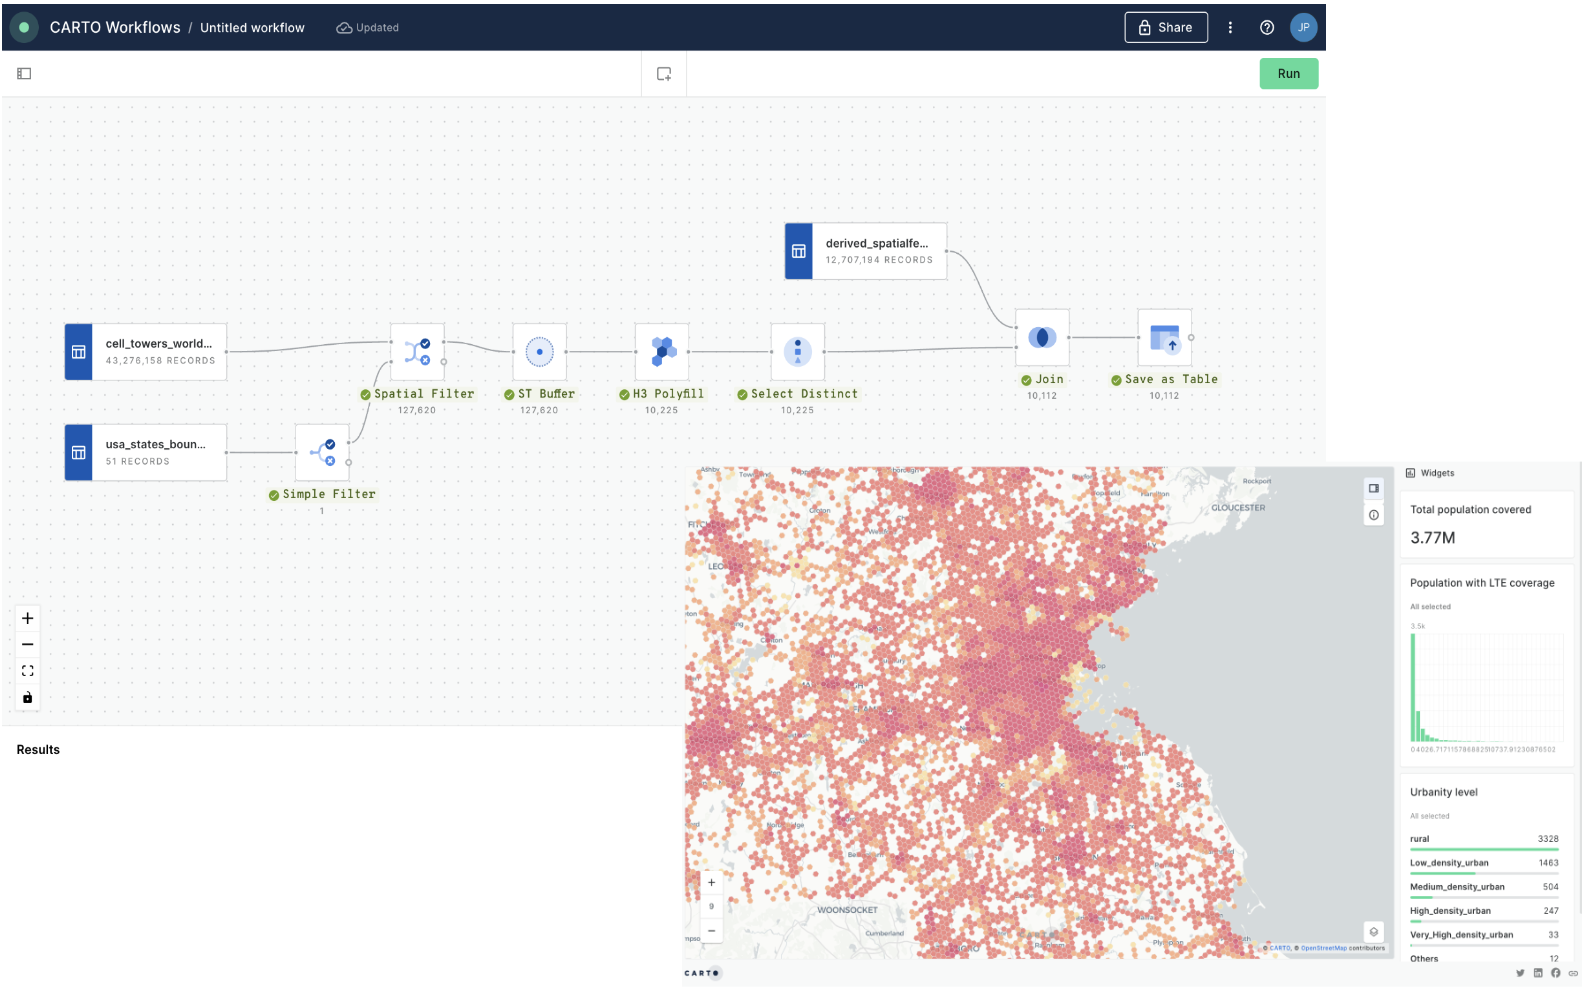
Estimate the population covered by LTE cells
Leverage CARTO Workflows and Builder to estimate and analyze the population that is covered by telecom network cells based on the LTE technology.
OOH
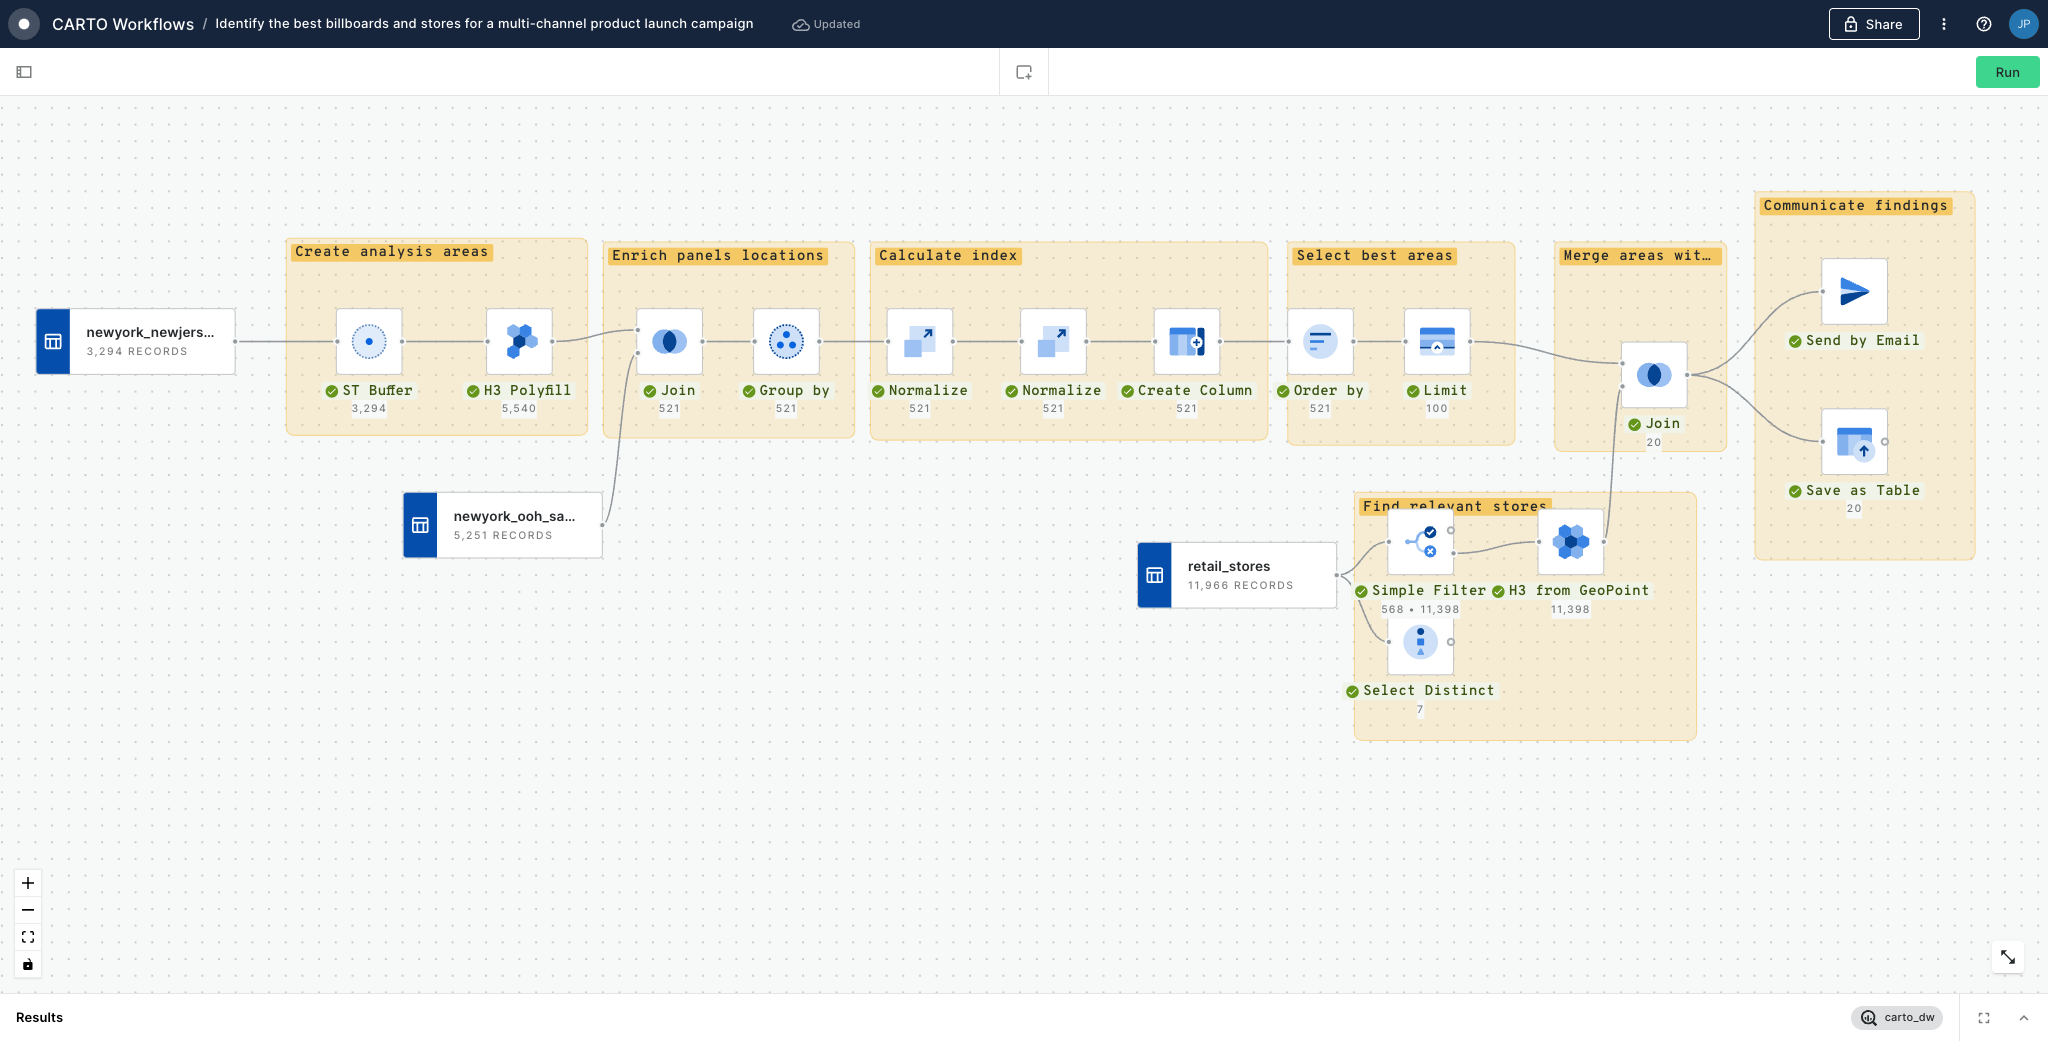
Identify the best billboards and stores for a multi-channel product launch campaign
Select what are the best billboards and retail stores in order to create a targeted product launch marketing campaign across multiple channels: out of home advertising and in-store promotions.

A no-code approach to optimizing OOH advertising locations [ Video 🎥 ]
Leveraging Spatial Indexes along with human mobility and spend data to optimize locations for OOH billboards in a low-code environment. While this example focuses on OOH, the approach could be utilized in other sectors such as CPG, retail and telecoms.
Transport & Logistics

Optimizing site selection for EV charging stations
In this tutorial, you will learn how to optimize the site selection process for EV charging stations at scale. While this guide focuses on EV charging stations, you can adapt this process to optimize site selection for any service or facility.

How to run scalable routing analysis the easy way [ Video 🎥 ]
Spatial Spotlight webinar in which we showcase how to run scalable routing analysis in your cloud data warehouse with a workflow built in CARTO.
Retail & CPG

Measuring merchant attractiveness and performance
In this tutorial, we’ll be scoring potential merchants across Manhattan to determine the best locations for our product: canned iced coffee!.
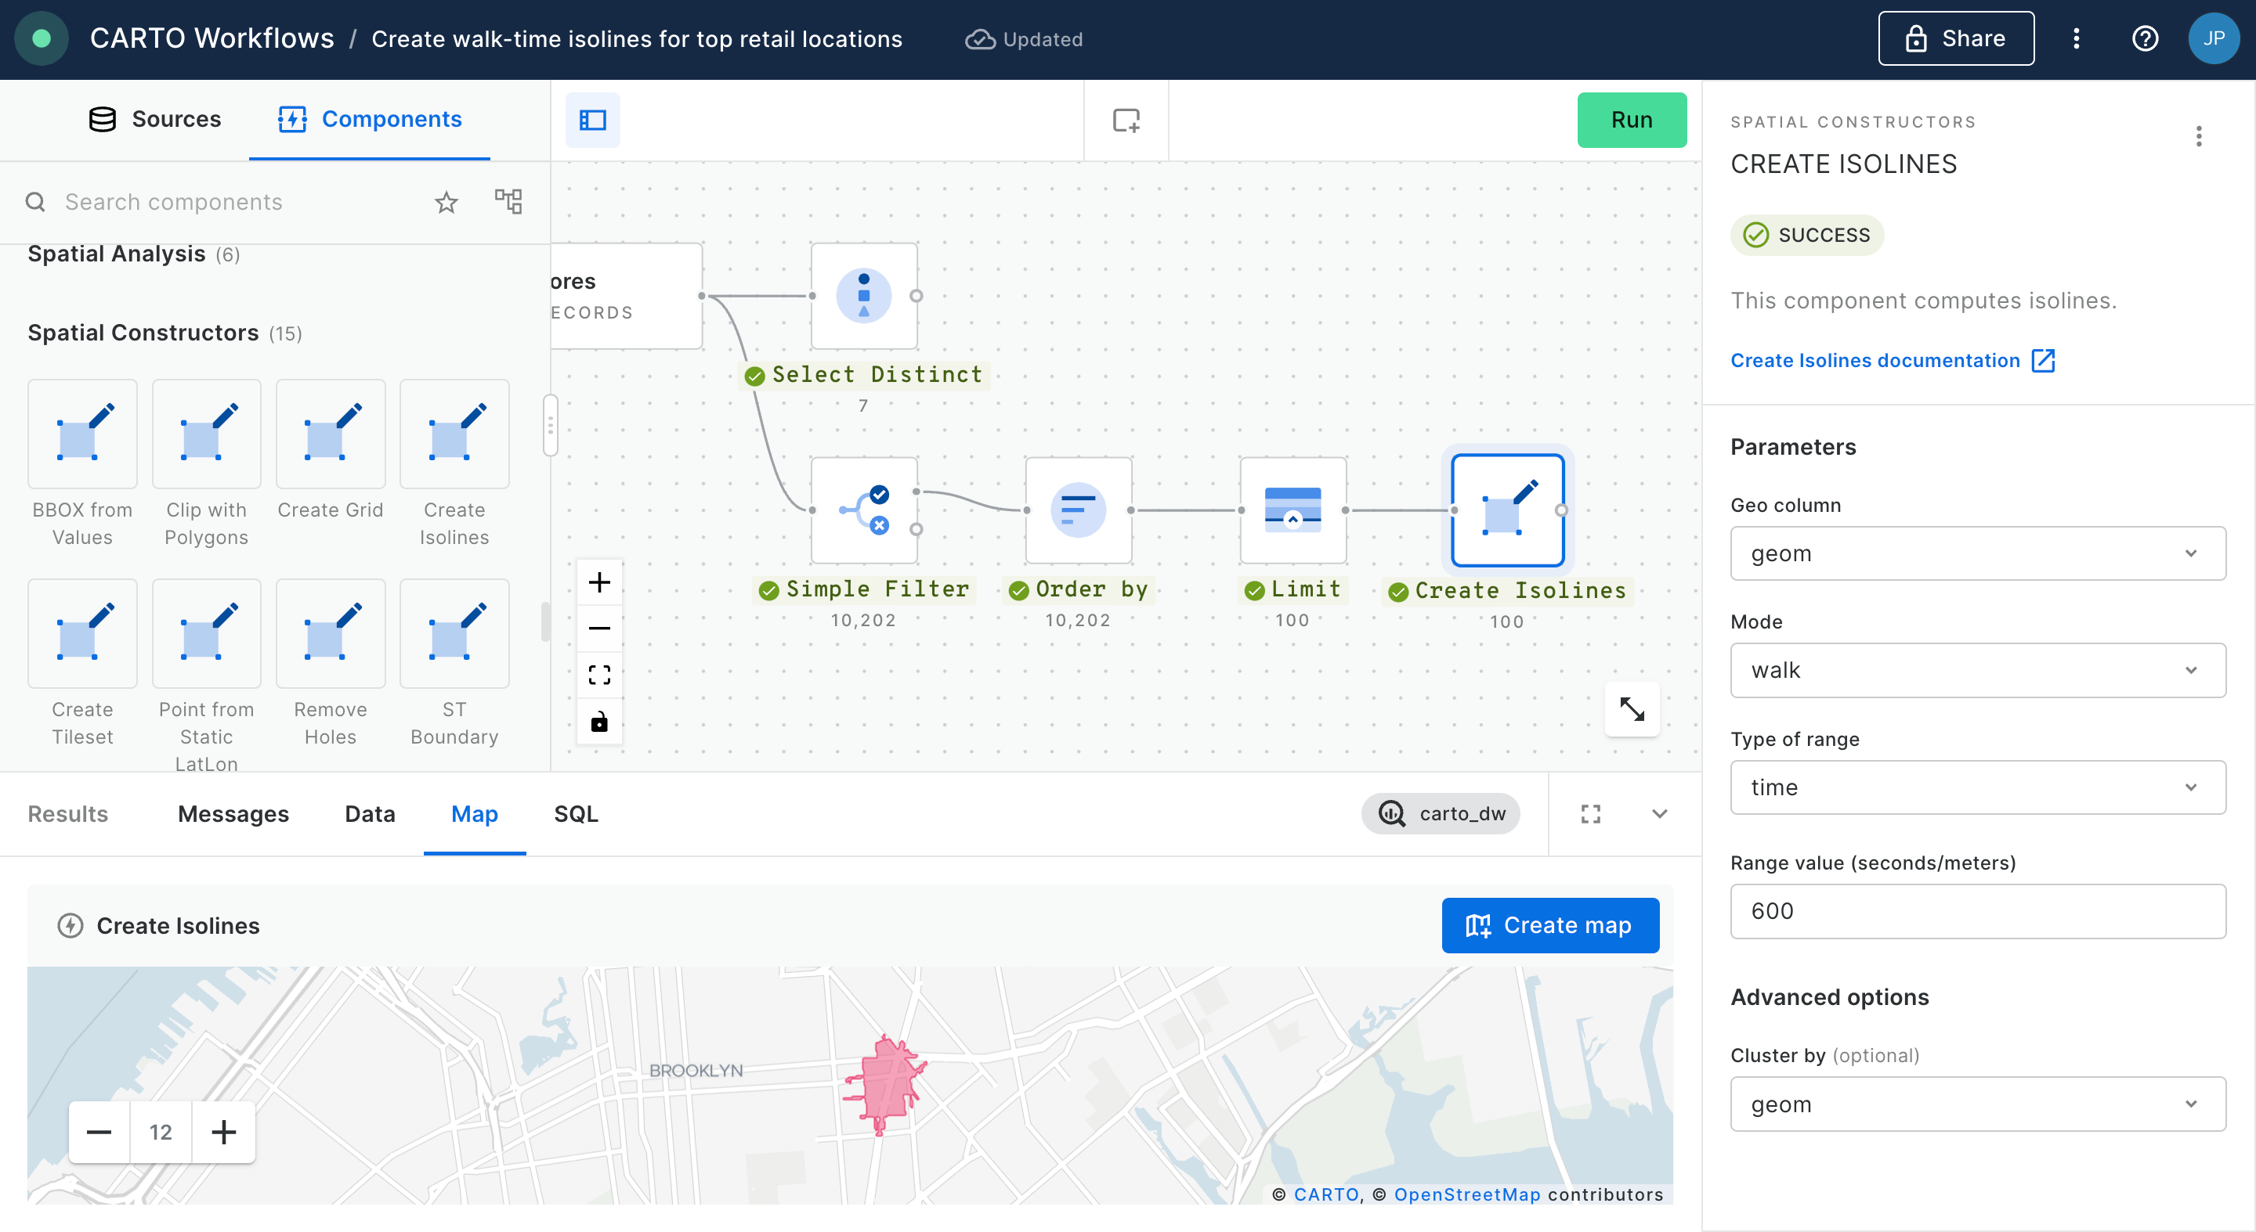
Calculate population living around top retail locations
Create walk time isolines for selected retail locations. It includes some examples of simple data manipulation, including filtering, ordering and limiting datasets.
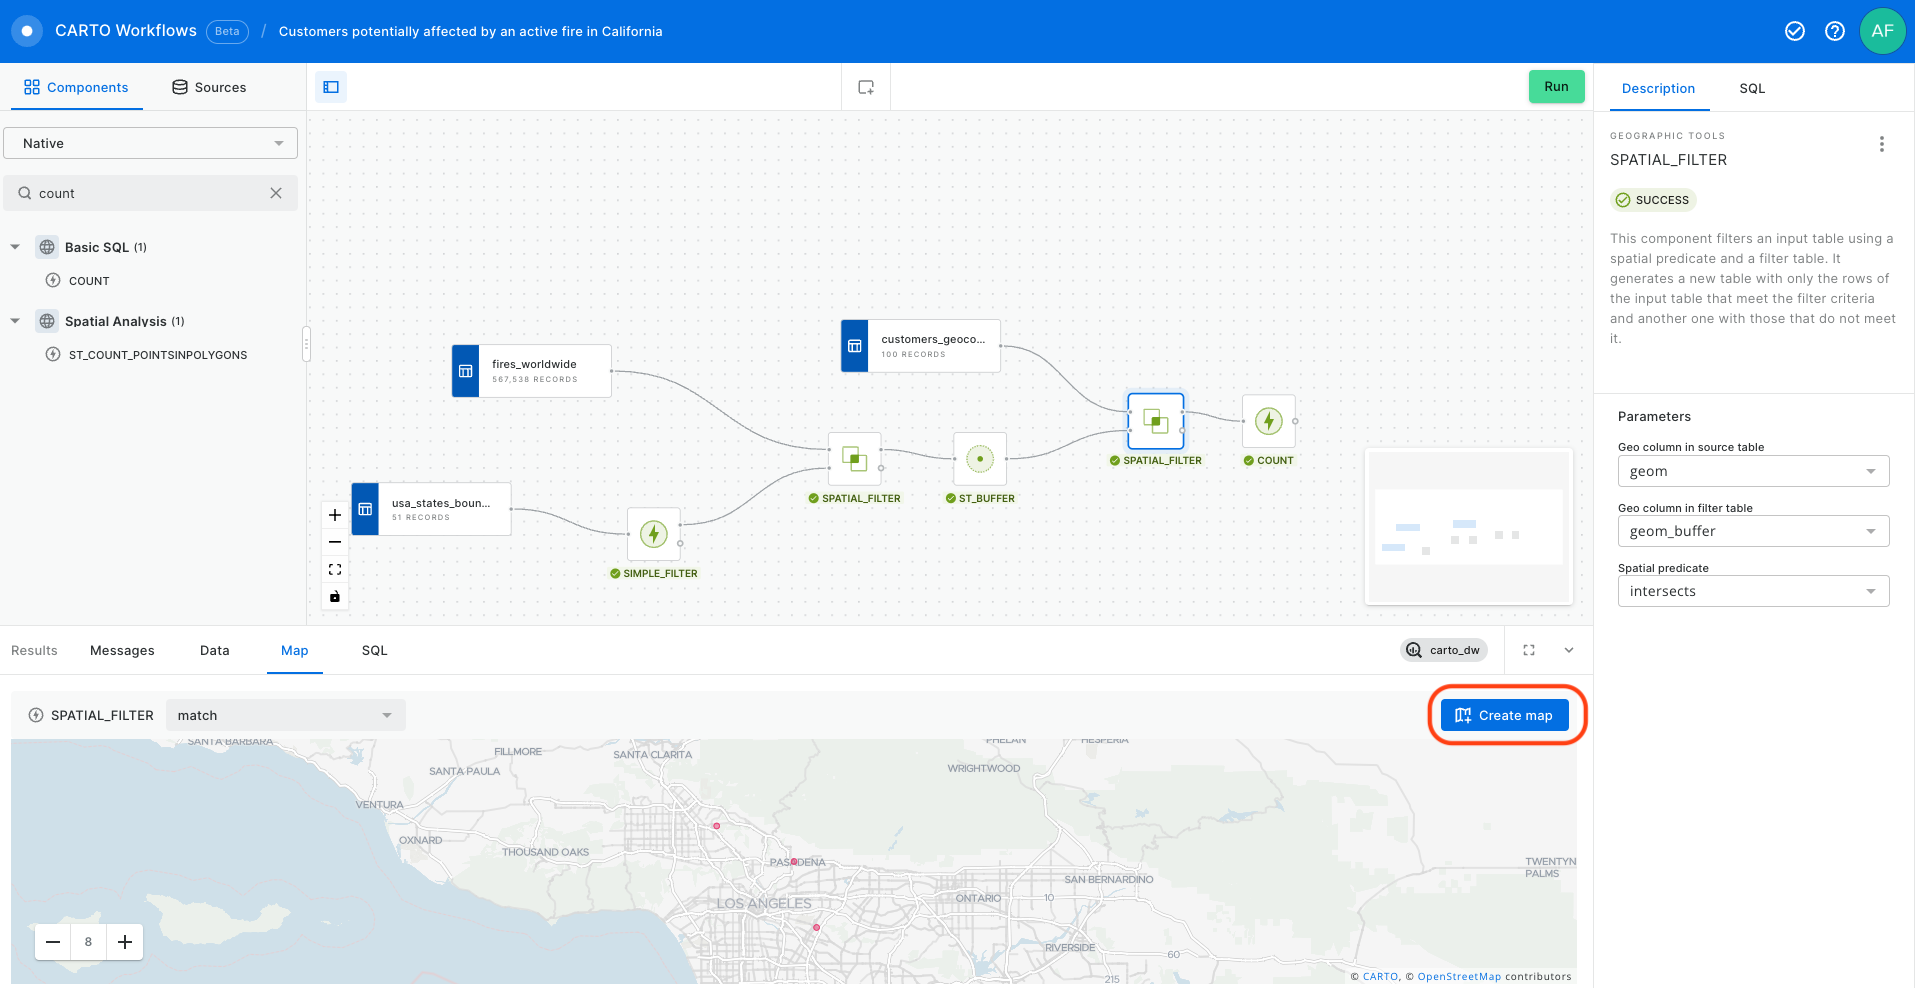
Identifying customers potentially affected by an active fire in California
Use CARTO Workflows to import and filter a public dataset that contains all active fires worldwide; apply a spatial filter to select only those happening in California. Create buffers around the fires and intersect with the location of customers to find those potentially affected by an active fire.
Cross-industry & Miscellaneous

How to optimize location planning for wind turbines [ Video 🎥 ]
Example on how to run a wind farm site feasibility analysis, including assessing terrain, demographics and infrastructure with an easy to build workflow.

How to use GenAI to optimize your spatial analysis [ Video 🎥 ]
Spatial Spotlight webinar in which we showcase how to use the ML Generate Text component to help us understand the results of our analysis.

Optimizing workload distribution through Territory Balancing
In this tutorial, we’ll explore how to optimize work distribution across teams by analyzing sales territory data to identify imbalances and redesign territories.

Transforming Telco Network Management Decisions with Location Allocation
In this tutorial, we’ll explore how network planners can determine the optimal locations for maintenance hubs or support facilities, ensuring that each area of the network is monitored and maintained efficiently through Location Allocation.
Last updated
Was this helpful?


