We provide a set of examples that showcase how to easily create aggregation tilesets allowing you to process and visualize very large spatial datasets stored in BigQuery. You can use this procedure if you have a point dataset (or anything that can be converted to points, such as polygon centroids) and you want to see it aggregated.
OSM buildings
We want are going to create a Point Aggregation Tileset to visualise all the features tagged as ‘building' in the OSM BigQuery Dataset. Since this dataset has different types of geometries for the buildings, we are going to use ST_CENTROID to ensure they all are points.
The extra column, aggregated_total, is adding a count of the number of buildings that are aggregated into a cell, which in this case are quadkeys made of z + resolution tiles, that is, each tile will be subdivided into 4^7 (16384) cells.
CALL`carto-un`.carto.CREATE_POINT_AGGREGATION_TILESET( R'''( SELECT ST_CENTROID(geometry) as geom FROM `bigquery-public-data.geo_openstreetmap.planet_features` WHERE 'building' IN (SELECT key FROM UNNEST(all_tags)) AND geometry IS NOT NULL )''','`your-project.your-dataset.osm_buildings_14_7`', R''' { "zoom_min": 0, "zoom_max": 14, "aggregation_resolution": 7, "aggregation_placement": "cell-centroid", "properties":{ "aggregated_total": { "formula":"count(*)", "type":"Number" } } } ''');
CALL`carto-un-eu`.carto.CREATE_POINT_AGGREGATION_TILESET( R'''( SELECT ST_CENTROID(geometry) as geom FROM `bigquery-public-data.geo_openstreetmap.planet_features` WHERE 'building' IN (SELECT key FROM UNNEST(all_tags)) AND geometry IS NOT NULL )''','`your-project.your-dataset.osm_buildings_14_7`', R''' { "zoom_min": 0, "zoom_max": 14, "aggregation_resolution": 7, "aggregation_placement": "cell-centroid", "properties":{ "aggregated_total": { "formula":"count(*)", "type":"Number" } } } ''');
CALL carto.CREATE_POINT_AGGREGATION_TILESET( R'''( SELECT ST_CENTROID(geometry) as geom FROM `bigquery-public-data.geo_openstreetmap.planet_features` WHERE 'building' IN (SELECT key FROM UNNEST(all_tags)) AND geometry IS NOT NULL )''','`your-project.your-dataset.osm_buildings_14_7`', R''' { "zoom_min": 0, "zoom_max": 14, "aggregation_resolution": 7, "aggregation_placement": "cell-centroid", "properties":{ "aggregated_total": { "formula":"count(*)", "type":"Number" } } } ''');
This process will take the over 300M buildings in the source table, aggregate them into cells and generate a table containing more than 4M tiles around the world.
New York City trees
In this case, we want to visualize an aggregation of the tree census of NYC. Since the table doesn’t have a geography column, we are going to create it on the fly using the latitude and longitude columns.
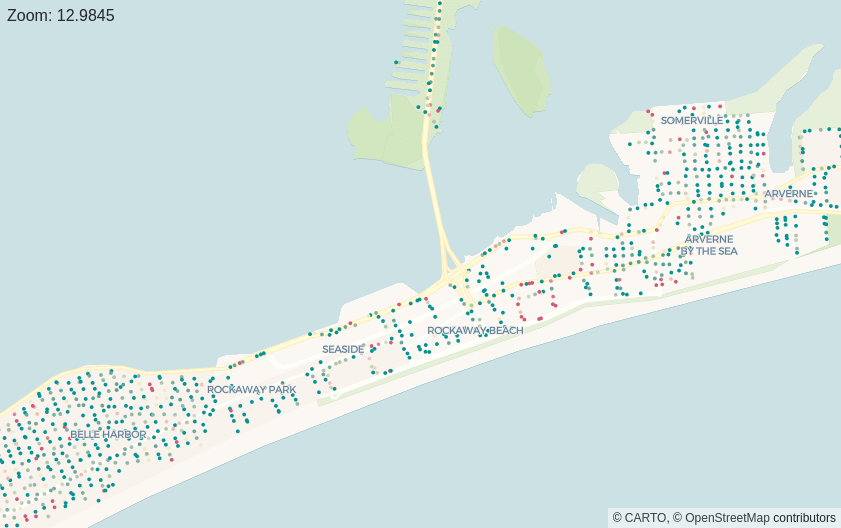
We also want to have access to the status and health of each aggregated cell, so we add some extra properties around that. Finally, as it is a more localized dataset, we want to generate higher zoom levels (16) and when we see individual points we want access to both their official id and their address.
Then we can style our visualization using the properties that we have added:
2020 world population
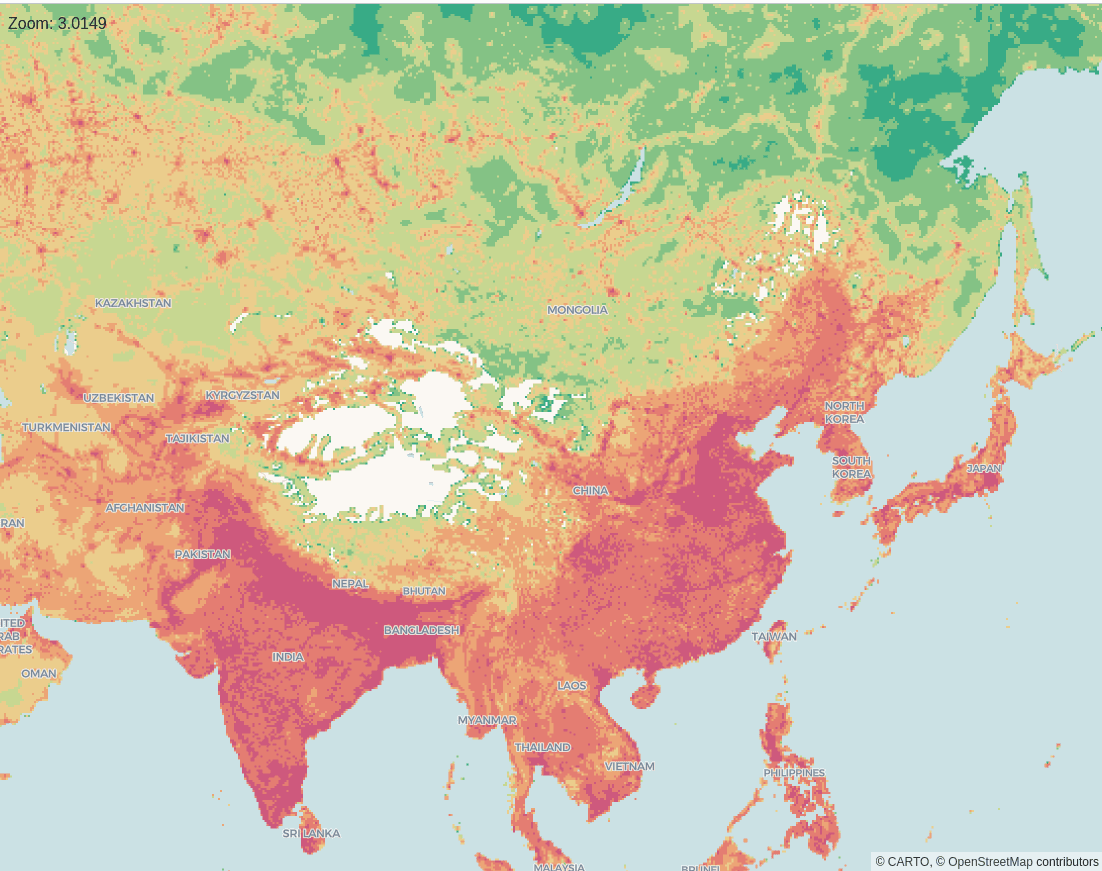
For this example, we are going to use a dataset from CARTO’s public Data Observatory to visualize the 2020 world population. We are going to use the already aggregated 1km * 1km grid cells:
CALL`carto-un`.carto.CREATE_POINT_AGGREGATION_TILESET( R'''( SELECT ST_Centroid(b.geom) as geom, population FROM `carto-do-public-data.worldpop.demographics_population_glo_grid1km_v1_yearly_2020` a INNER JOIN `carto-do-public-data.worldpop.geography_glo_grid1km_v1` b ON (a.geoid = b.geoid) )''','`your-project.your-dataset.wpop_2020_1km_cell`', R''' { "zoom_max": 6, "aggregation_resolution": 7, "aggregation_placement": "cell", "properties":{ "population": { "formula": "sum(population)", "type": "Number" } } } ''');
CALL`carto-un-eu`.carto.CREATE_POINT_AGGREGATION_TILESET( R'''( SELECT ST_Centroid(b.geom) as geom, population FROM `carto-do-public-data.worldpop.demographics_population_glo_grid1km_v1_yearly_2020` a INNER JOIN `carto-do-public-data.worldpop.geography_glo_grid1km_v1` b ON (a.geoid = b.geoid) )''','`your-project.your-dataset.wpop_2020_1km_cell`', R''' { "zoom_max": 6, "aggregation_resolution": 7, "aggregation_placement": "cell", "properties":{ "population": { "formula": "sum(population)", "type": "Number" } } } ''');
CALL carto.CREATE_POINT_AGGREGATION_TILESET( R'''( SELECT ST_Centroid(b.geom) as geom, population FROM `carto-do-public-data.worldpop.demographics_population_glo_grid1km_v1_yearly_2020` a INNER JOIN `carto-do-public-data.worldpop.geography_glo_grid1km_v1` b ON (a.geoid = b.geoid) )''','`your-project.your-dataset.wpop_2020_1km_cell`', R''' { "zoom_max": 6, "aggregation_resolution": 7, "aggregation_placement": "cell", "properties":{ "population": { "formula": "sum(population)", "type": "Number" } } } ''');
Note that since this dataset contains already aggregated data, it doesn’t make sense to visualize it at very high zoom levels, but visualize the data at a country scale.
This project has received funding from the European Union’s Horizon 2020 research and innovation programme under grant agreement No 960401.