Using raster and vector data to calculate total rooftop PV potential in the US

In spatial analytics, two main data types are used: raster and vector. Combining these two data formats can provide a comprehensive and powerful solution for various analyses. A common use case for combining raster and vector data in geospatial analysis is land use and land cover mapping. The raster data, such as satellite imagery, provides a detailed view of the Earth's surface, while vector data, such as GIS polygon boundaries, provides information on administrative and political units. By overlaying these two data types, a complete picture of land use and land cover can be generated, allowing for in-depth analysis and decision making in areas such as urban planning, natural resource management, real estate, and insurance.
In this example, you will learn how to easily combine raster and vector data using the raster module of the Analytics Toolbox. In particular, the following use case explains all the steps required to compute the total rooftop photovoltaic power (PV) potential in the United States in less than 3 minutes by combining:
raster data for PV power potential from the Global Solar Atlas, and
vector data for the building boundaries from OSM publicly available in BigQuery:
`bigquery-public-data.geo_openstreetmap.planet_features_multipolygons`
Step 1. Find your raster data and download it
First, we need to find the raster containing the data of interest. We download the GIS LTAy_AvgDailyTotals data file that contains solar resource (GHI, DNI, DIF, GTI, OPTA), PV power potential (PVOUT) and other parameters in raster format.
Note that storing your data in cloud storage might be more convenient for you than managing the raster data on your local computer.
Step 2. Re-project the raster to a quadbin grid
Next, we will re-project the raster data to a quadbin grid. For this, we use gdalwarp on the previously unzipped raster file PVOUT.tif. gdalwapr is an image re-projection and warping utility. We just need to run the following:
Note that this re-projection is not required but is highly recommended because the current beta version of the raster module in the Analytics Toolbox is optimized for quadbin grids and our support for generic raster is still in a very experimental phase.
Step 3. Install CARTO's Raster Loader
We are now ready to upload the raster data to BigQuery using CARTO’s Raster Loader, a Python package for loading GIS raster data to standard cloud-based data warehouses that don’t natively support raster data. This package can be easily installed via pip
Step 4. Upload raster to BigQuery
Once installed, we can proceed to upload it to BigQuery through the carto command-line interface (CLI):
Note that this package can be also used as a Python library that you can import and use in your Python projects.
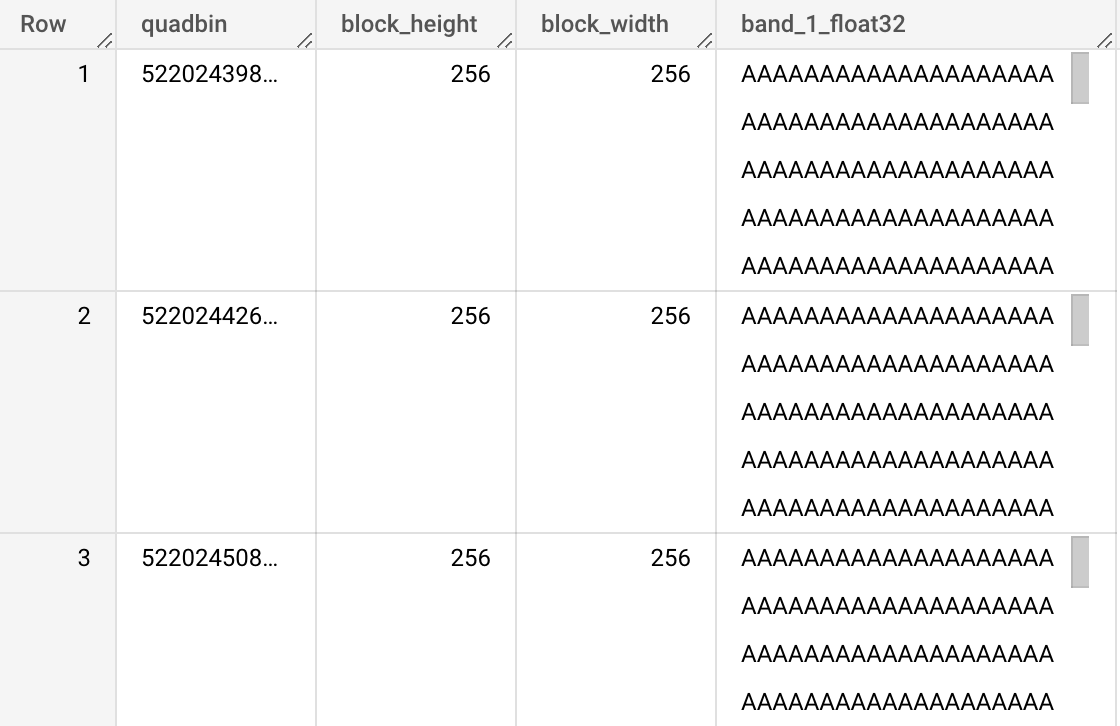
A new table `<my-bigquery-project>.<my-bigquery-dataset>.PVOUT_USA` is created in BigQuery containing the quadbin raster data in a compacted format.

Step 5. Compute the PV power potential of every building in the US
With the raster data already in BigQuery, we can now assign to every building in the US its corresponding PV power potential using the RASTER_ST_GETVALUE_FROM_TABLE procedure. We only need to pass:
The qualified name of the table with the raster data:
<my-bigquery-project>.<my-bigquery-dataset>.PVOUT_USAThe qualified name of the table with the building geometries (vector data):
carto-demo-data.demo_tables.osm_buildings_usaCustom options (see reference).
The name of the output table:
<my-bigquery-project>.<my-bigquery-dataset>.USA_buildings_PVOUT_enriched
Note that we made US building data publicly available through table `carto-demo-data.demo_tables.osm_buildings_usa` so users don't need to process the entire world's data.
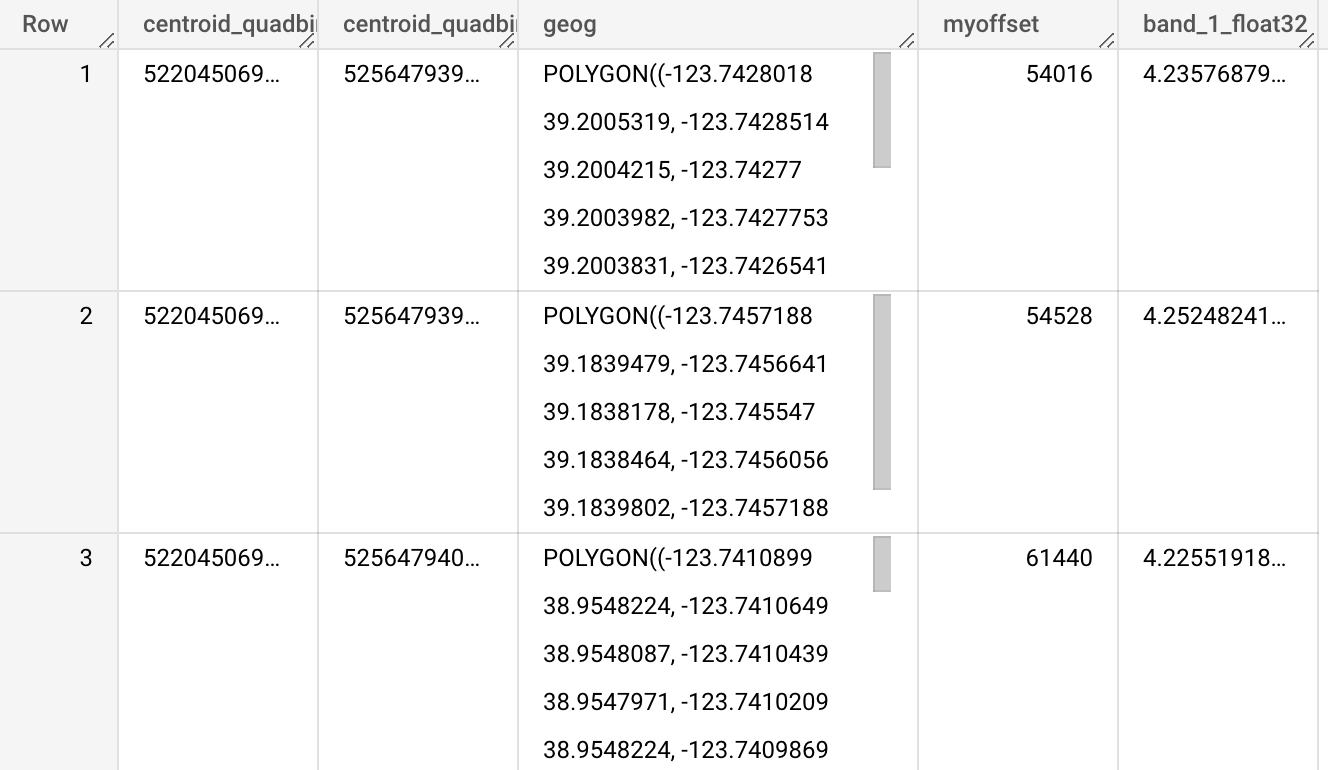
The new table will contain, for every building boundary (geog) its corresponding PV power potential (band_1_float32).

Step 6. Calculate the total rooftop PV potential in the US
Finally, we can calculate the total rooftop PV potential in the US with a simple query using the previously enriched table:

Last updated
Was this helpful?

