Analyzing store location coverage using a Voronoi diagram

Requirements
To run this example you'll need:
The latest version of the Analytics Toolbox Core Native App installed in your Snowflake database
Optional: An active CARTO organization to visualize the results in a map
Example
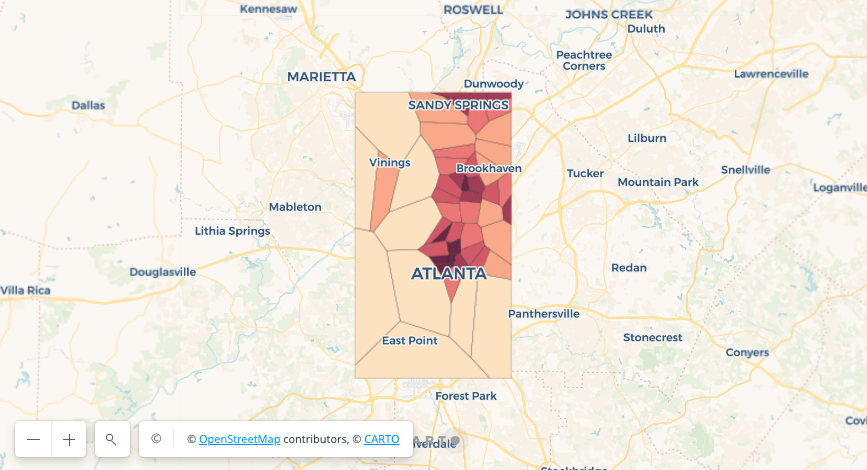
Voronoi diagrams are a very useful tool to build influence regions from a set of points and the Analytics Toolbox provides a convenient function to build them. An example application of these diagrams is the calculation of the coverage areas of a series of Starbucks stores. In the following query we are going to calculate these influence areas in Atlanta.
The result can be seen in the visualization below, where the color of each polygon indicates its area, which gives an insight on the coverage provided by each store.

Prior to the calculation of the Voronoi diagrams, we use ST_ENVELOPE in order to calculate a boundary that covers all the Starbucks stores in our selection. This boundary is used to clip the resulting Voronoi polygons. If the bounding box parameter were not passed to ST_VORONOIPOLYGONS, the polygons would extend all over the map.
With this simple analysis we can identify at a glance areas where the coverage could be improved and therefore new stores could be placed.
Last updated
Was this helpful?

