> For the complete documentation index, see [llms.txt](https://academy.carto.com/llms.txt). Markdown versions of documentation pages are available by appending `.md` to page URLs; this page is available as [Markdown](https://academy.carto.com/creating-workflows/workflow-templates/statistics.md).
# Statistics
### Identify hotspots of specific Point of Interest type
CARTO DW
BigQuery
Snowflake
Redshift
PostgreSQL
Snowflake
Redshift
PostgreSQL
CARTO DW
✅
✅
✅
❌
❌
This example demonstrates how to identify hotspots using Getis Ors Gi\* statistic. We use OpenStreetMap amenity POIs in Stockholm.
Read [this full guide](https://docs.carto.com/data-and-analysis/analytics-toolbox-for-bigquery/examples/identifying-amenity-hotspots-in-stockholm) to learn more.
[**Download example**](https://storage.googleapis.com/carto-workflows-examples/files/poi_hotspot.sql)
### Space-time hotspot analysis
CARTO DW
BigQuery
Snowflake
Redshift
PostgreSQL
Snowflake
Redshift
PostgreSQL
CARTO DW
✅
✅
✅
❌
❌
This example shows how to identify spacetime clusters. In particular, we will perform space temporal analysis to identify traffic accident hotspots using the location and time of accidents in the city of Barcelona in 2018.
Spacetime hotspots are computed using an extension of the Getis Ord Gi\* statistics that measures the degree to which data values are clustered together in space and time.
[**Download example**](https://storage.googleapis.com/carto-workflows-examples/files/space_time_hotspot.sql)
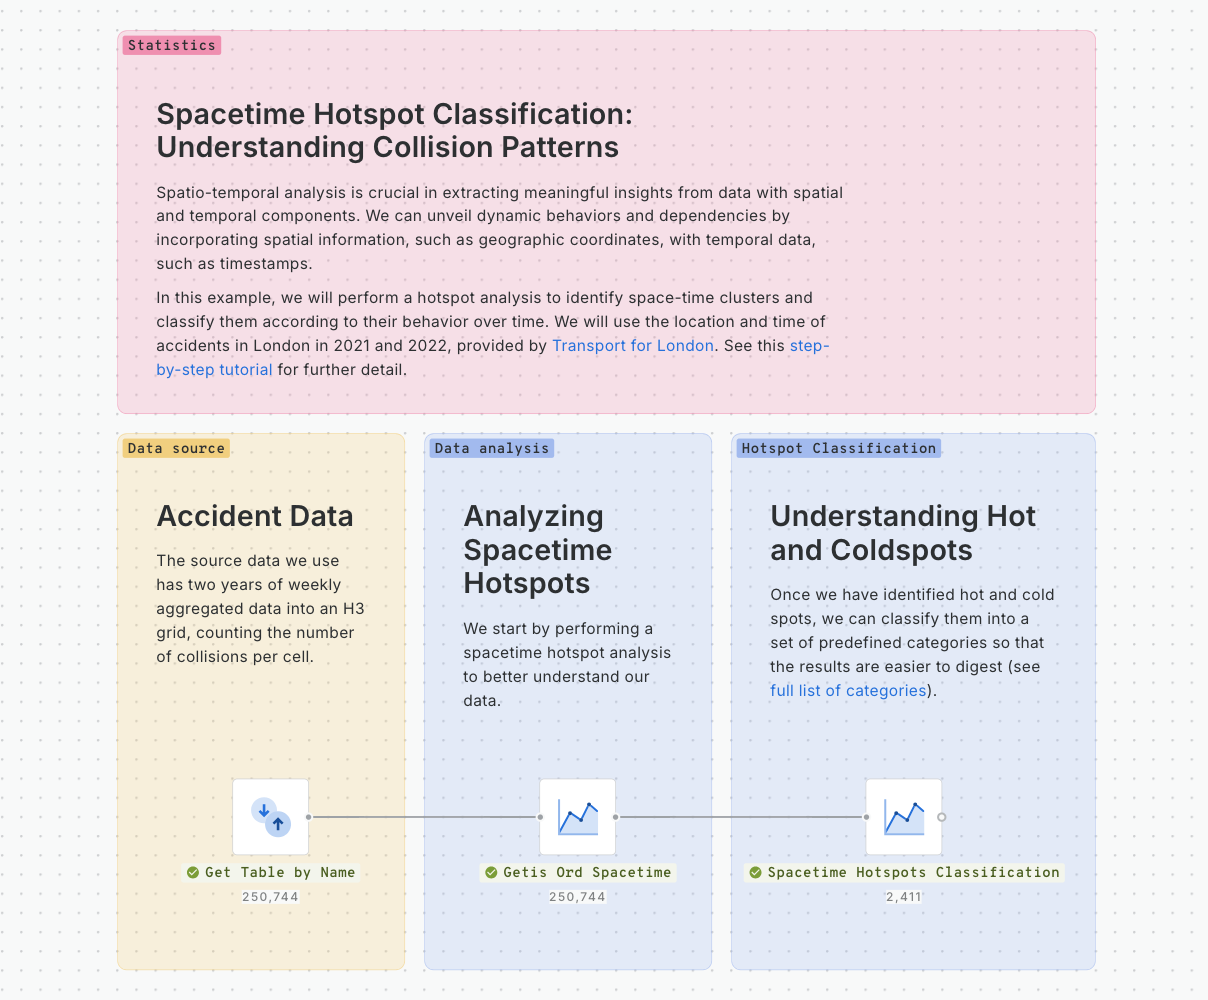
This example shows how to use Workflows to identify space-time clusters and classify them according to their behavior over time.
Read [this guide](/advanced-spatial-analytics/spatial-analytics-for-bigquery/step-by-step-tutorials/spacetime-hotspot-classification-understanding-collision-patterns.md) to learn more.
[**Download example**](https://storage.googleapis.com/carto-workflows-examples/files/spacetime_hotspot_classification.sql)
### Time series clustering: Identifying areas with similar traffic accident patterns
CARTO DW
BigQuery
Snowflake
Redshift
PostgreSQL
Snowflake
Redshift
PostgreSQL
CARTO DW
✅
✅
❌
❌
❌
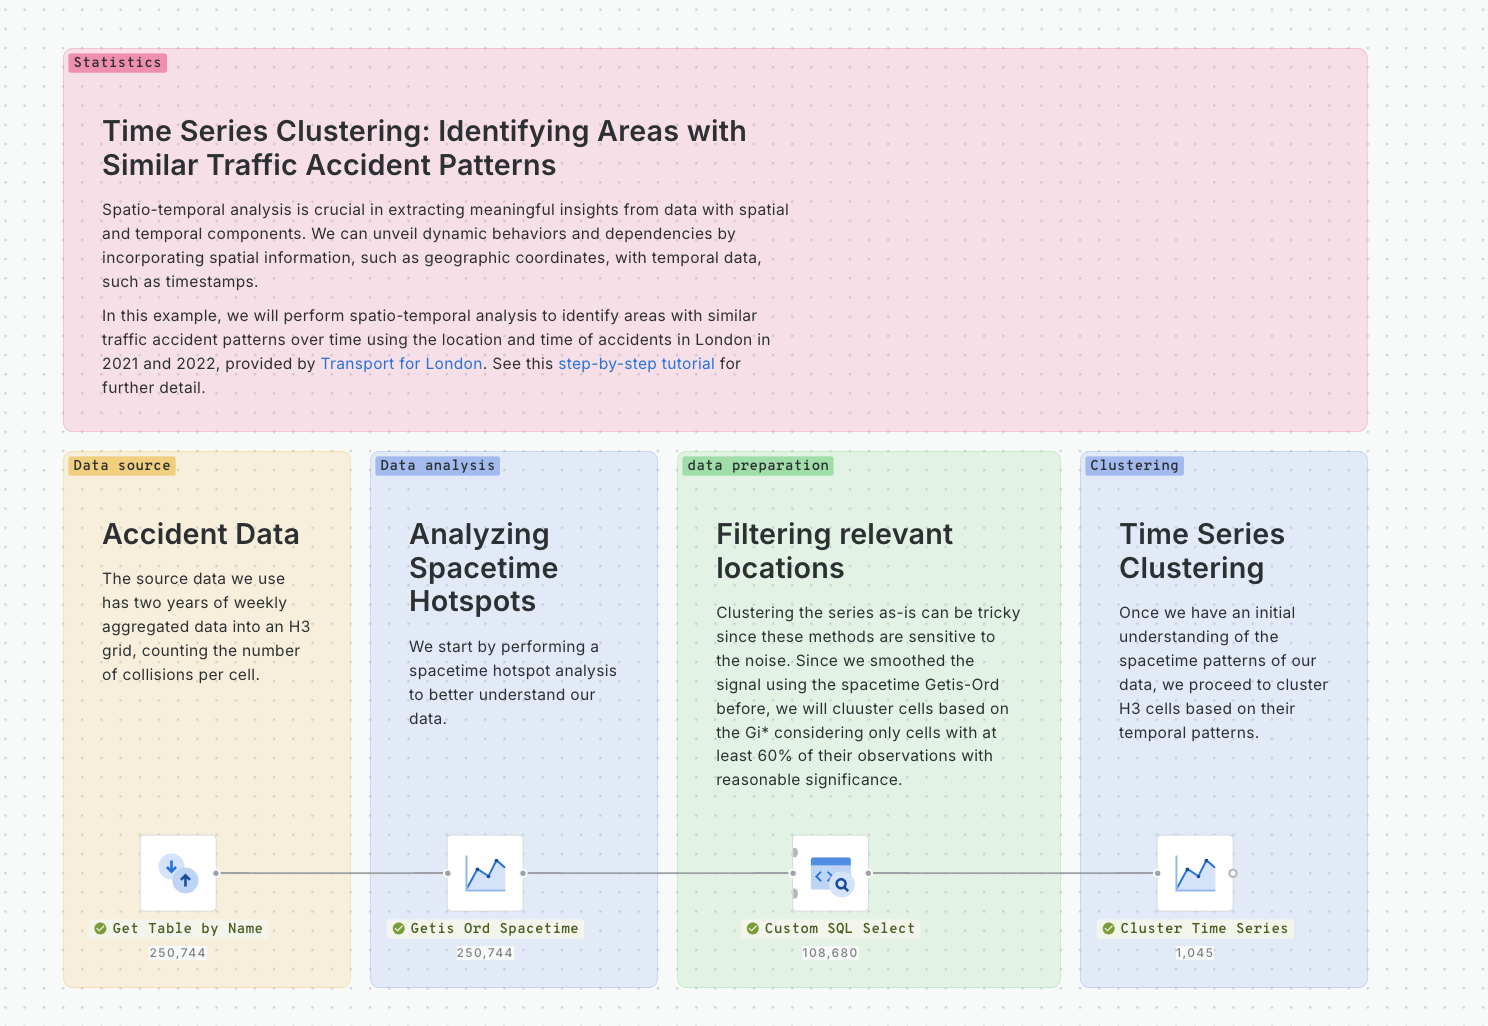
This example shows how to use Workflows to identify areas with similar traffic accident patterns over time using their location and time.
Read [this guide](/advanced-spatial-analytics/spatial-analytics-for-bigquery/step-by-step-tutorials/time-series-clustering-identifying-areas-with-similar-traffic-accident-patterns.md) to learn more.
[**Download example**](https://storage.googleapis.com/carto-workflows-examples/files/time_series_clustering.sql)
### Computing the spatial auto-correlation of point of interest locations
CARTO DW
BigQuery
Snowflake
Redshift
PostgreSQL
Snowflake
Redshift
PostgreSQL
CARTO DW
✅
✅
✅
❌
❌
This example demonstrates how to use Workflows to analyze the spatial correlation of POI locations in Berlin using OpenStreetMap data and the Moran’s I function available in the statistics module.
Read [this](https://docs.carto.com/data-and-analysis/analytics-toolbox-for-bigquery/examples/computing-the-spatial-autocorrelation-of-pois-locations-in-berlin) guide to learn more.
[**Download example**](https://storage.googleapis.com/carto-workflows-examples/files/poi_spatial_autocorrelation.sql)
### Applying GWR to model the local spatial relationships in your data
CARTO DW
BigQuery
Snowflake
Redshift
PostgreSQL
Snowflake
Redshift
PostgreSQL
CARTO DW
✅
✅
✅
❌
❌
This example demonstrate how to use Worklfows to apply a Geographically Weighted Regression model to find relationships between a set of predictor variables and an outcome of interest.
In this case, we're going to analyze the relationship between Airbnb’s listings in Berlin and the number of bedrooms and bathrooms available at these listings.
Read [this full guide](https://docs.carto.com/data-and-analysis/analytics-toolbox-for-bigquery/examples/applying-gwr-to-understand-airbnb-listings-prices) to learn more.
[**Download example**](https://storage.googleapis.com/carto-workflows-examples/files/gwr.sql)
### Create a composite score with the supervised method (BigQuery)
CARTO DW
BigQuery
Snowflake
Redshift
PostgreSQL
Snowflake
Redshift
PostgreSQL
CARTO DW
✅
✅
❌
❌
❌
A [composite indicator](https://academy.carto.com/advanced-spatial-analytics/spatial-analytics-for-bigquery/step-by-step-tutorials/how-to-create-a-composite-score-with-your-spatial-data#computing-a-composite-score-supervised-method) is an aggregation of variables which aims to measure complex and multidimensional concepts which are difficult to define, and cannot be measured directly. Examples include [innovation](https://en.wikipedia.org/wiki/Global_Innovation_Index), [human development](https://en.wikipedia.org/wiki/Human_Development_Index) or [environmental performance](https://en.wikipedia.org/wiki/Environmental_Performance_Index).
[**Download example**](https://storage.googleapis.com/carto-workflows-examples/files/composite-score-supervised.sql)
### Create a composite score with the unsupervised method (BigQuery)
CARTO DW
BigQuery
Snowflake
Redshift
PostgreSQL
Snowflake
Redshift
PostgreSQL
CARTO DW
✅
✅
❌
❌
❌
A [composite indicator](https://academy.carto.com/advanced-spatial-analytics/spatial-analytics-for-bigquery/step-by-step-tutorials/how-to-create-a-composite-score-with-your-spatial-data#computing-a-composite-score-supervised-method) is an aggregation of variables which aims to measure complex and multidimensional concepts which are difficult to define, and cannot be measured directly. Examples include [innovation](https://en.wikipedia.org/wiki/Global_Innovation_Index), [human development](https://en.wikipedia.org/wiki/Human_Development_Index), [environmental performance](https://en.wikipedia.org/wiki/Environmental_Performance_Index), and so on.
In this example, we will use the [Create Score Unsupervised](https://docs.carto.com/carto-user-manual/workflows/components/statistics#composite-score-unsupervised) component, to identify areas in Milan with a larger market potential for a wellness & beauty center mainly aimed for teenage and adult women.
[**Download example**](https://storage.googleapis.com/carto-workflows-examples/files/composite-score-unsupervised.sql)
### Detect Space-time anomalies
CARTO DW
BigQuery
Snowflake
Redshift
PostgreSQL
Snowflake
Redshift
PostgreSQL
CARTO DW
✅
✅
❌
❌
❌
This example workflow uses the Detect Space-time Anomalies component to find the most significant clusters of anomalous data.
We’ll create a workflow to improve portfolio management for real estate insurers by identifying vacant buildings in areas experiencing anomalously high rates of violent crime.
[**Download example**](https://storage.googleapis.com/carto-workflows-examples/files/statistics_detect_spacetime_anomalies.sql)
---
# Agent Instructions
This documentation is published with GitBook. GitBook is the documentation platform designed so that both humans and AI agents can read, navigate, and reason over technical content effectively. Learn more at gitbook.com.
## Querying This Documentation
If you need additional information that is not directly available in this page, you can query the documentation dynamically by asking a question.
Perform an HTTP GET request on the current page URL with the `ask` query parameter, and the optional `goal` query parameter:
```
GET https://academy.carto.com/creating-workflows/workflow-templates/statistics.md?ask=&goal=
```
`ask` is the immediate question: it should be specific, self-contained, and written in natural language.
`goal` is optional and describes the broader end goal you are ultimately trying to accomplish on behalf of the user. GitBook uses it to tailor the answer towards what is most useful for that goal.
The response will contain a direct answer to the question and relevant excerpts and sources from the documentation.
Use this mechanism when the answer is not explicitly present in the current page, you need clarification or additional context, or you want to retrieve related documentation sections.