

Identifying customers potentially affected by an active fire in California

In this example we will see how we can identify customers potentially affected by an active fire in California using CARTO Workflows. This approach is one of the building blocks of spatial analysis and can be easily adapted to any use case where you need to know which features are within a distance of another feature.
All of the data that you need can be found in the CARTO Data Warehouse (instructions below).
To begin, click on "+ New workflow" in the main page of the Workflows section. If it will be your first workflow, click on "Create your first workflow".
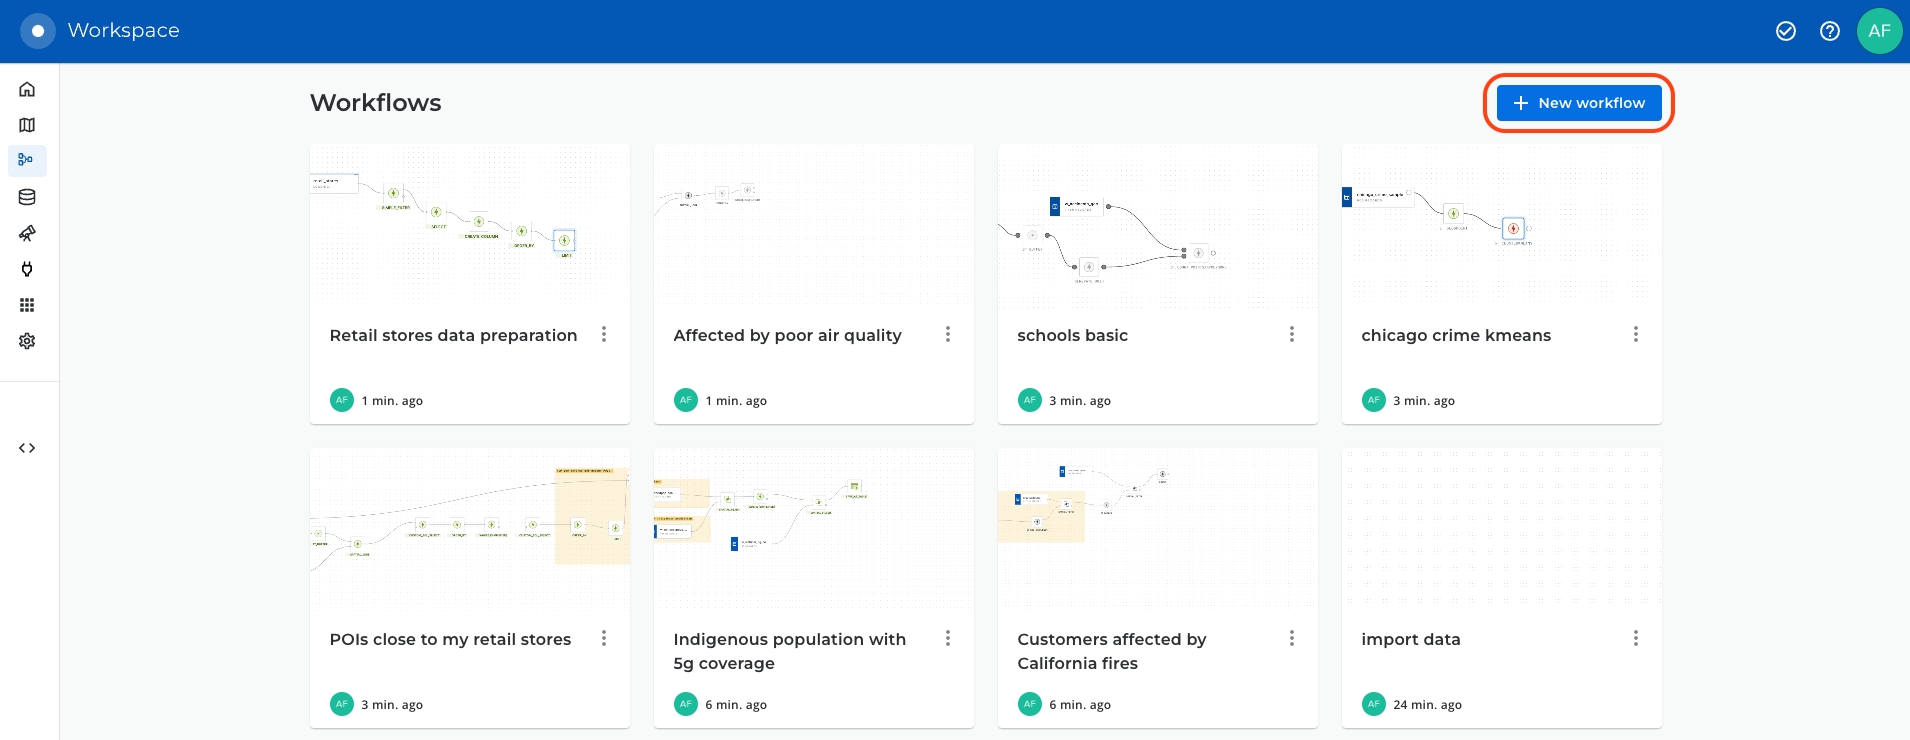
To begin, click on "+ New workflow" in the main page of the Workflows section. If it will be your first workflow, you will instead see the option to "Create your first workflow".
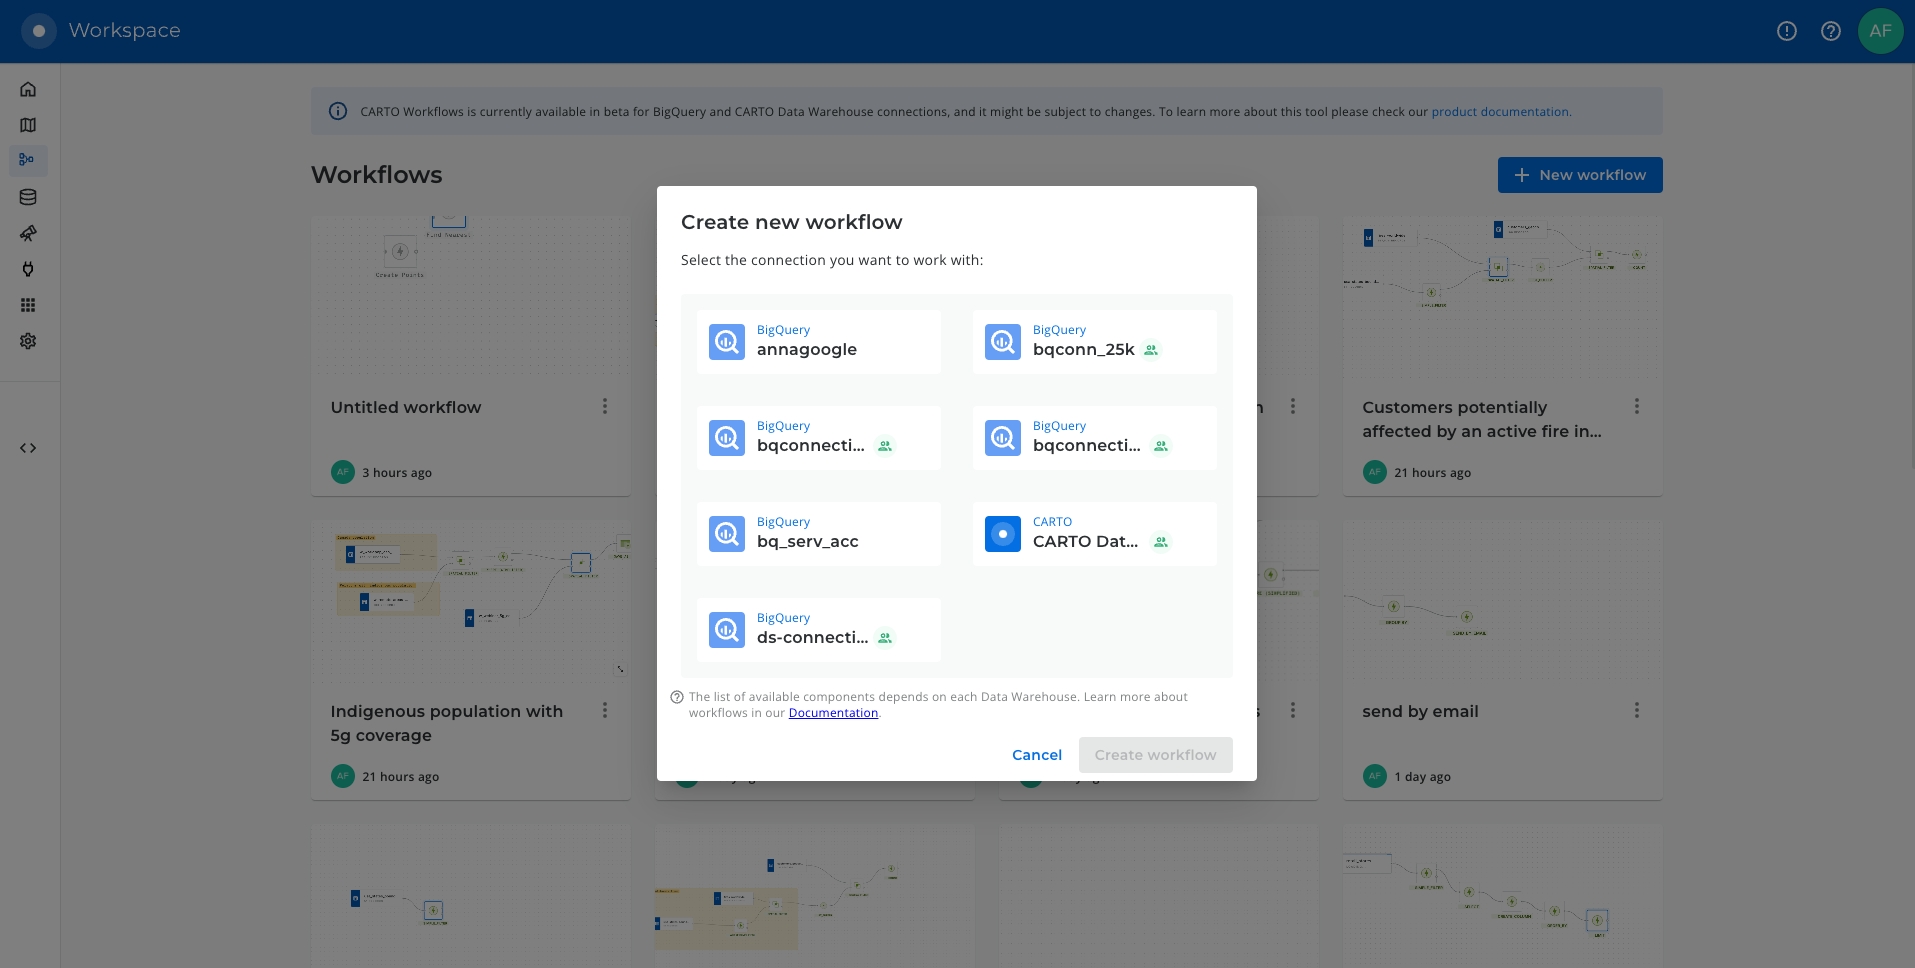
From here, you can drag and drop data sources and analytical components that you want to use from the explorer on the left side of the screen into the Workflow canvas that is located at the center of the interface.
Let's add the usa_states_boundaries data table into our workflow from the demo_tables dataset available in the CARTO Data Warehouse connection. You can find this under Sources > Connection > demo data > demo_tables.

Then filter only the boundary of the state of California using the Simple Filter component; set the column as name, the operator as equal to and the value as California.
Run your workflow!
You can run the workflow at any point in this tutorial - only new or edited components will be run, not the entire workflow. You can also just wait to run until the end.

Next, let's explore fires in this study area.
From the same location that you added usa_states_boundaries, add fires_worldwide to the canvas. For ease later, you'll want to drop it just above the Simple Filter component from the previous step.
Next, add a Spatial Filter component to filter only the fires that fall inside the digital boundary of the state of California. Connect fires_worldwide to the top input and Simple Filter to the bottom. Specify both geo columns as "geom" and the spatial predicate as intersect (meaning the filter will apply to all features where any part of their shape intersects California).
To keep your workflow well organized, use the Add a note (Aa) tool at the top of the window to draw a box around this section of the workflow. You can use any markdown syntax to format this box - our example uses ## Fires in California.

Now, use the ST Buffer component to generate a 5 km radius buffer around each of the active fires in California.

Next, add third data source with a sample of customer data from an illustrative CRM system. You can find it as customers_geocoded in demo_tables inside your CARTO Data Warehouse.
Now let’s add another Spatial Filter component to know which of our customers live within the 5 km buffer around the active fires and thus could potentially be affected.

You'll notice we now have a couple of instances of duplicated records where these intersect multiple buffers. We can easily remove these with a Remove duplicated component. Now is also a great time to add a second note box to your workflow, this time called ## Filter customers.

You can explore the results of this analysis at the bottom panel of the window, via both the Data and Map tabs. From the map tab, you can select Create map to automatically create a map in CARTO Builder.
Head to the Data visualization section of the Academy next to explore tutorials for building impactful maps!
Last updated
Was this helpful?